What 2,000 Chennai commutes really cost

Read the deck as text
Chennai Commute Report
11 months · 1,881 commuters · one honest dataset
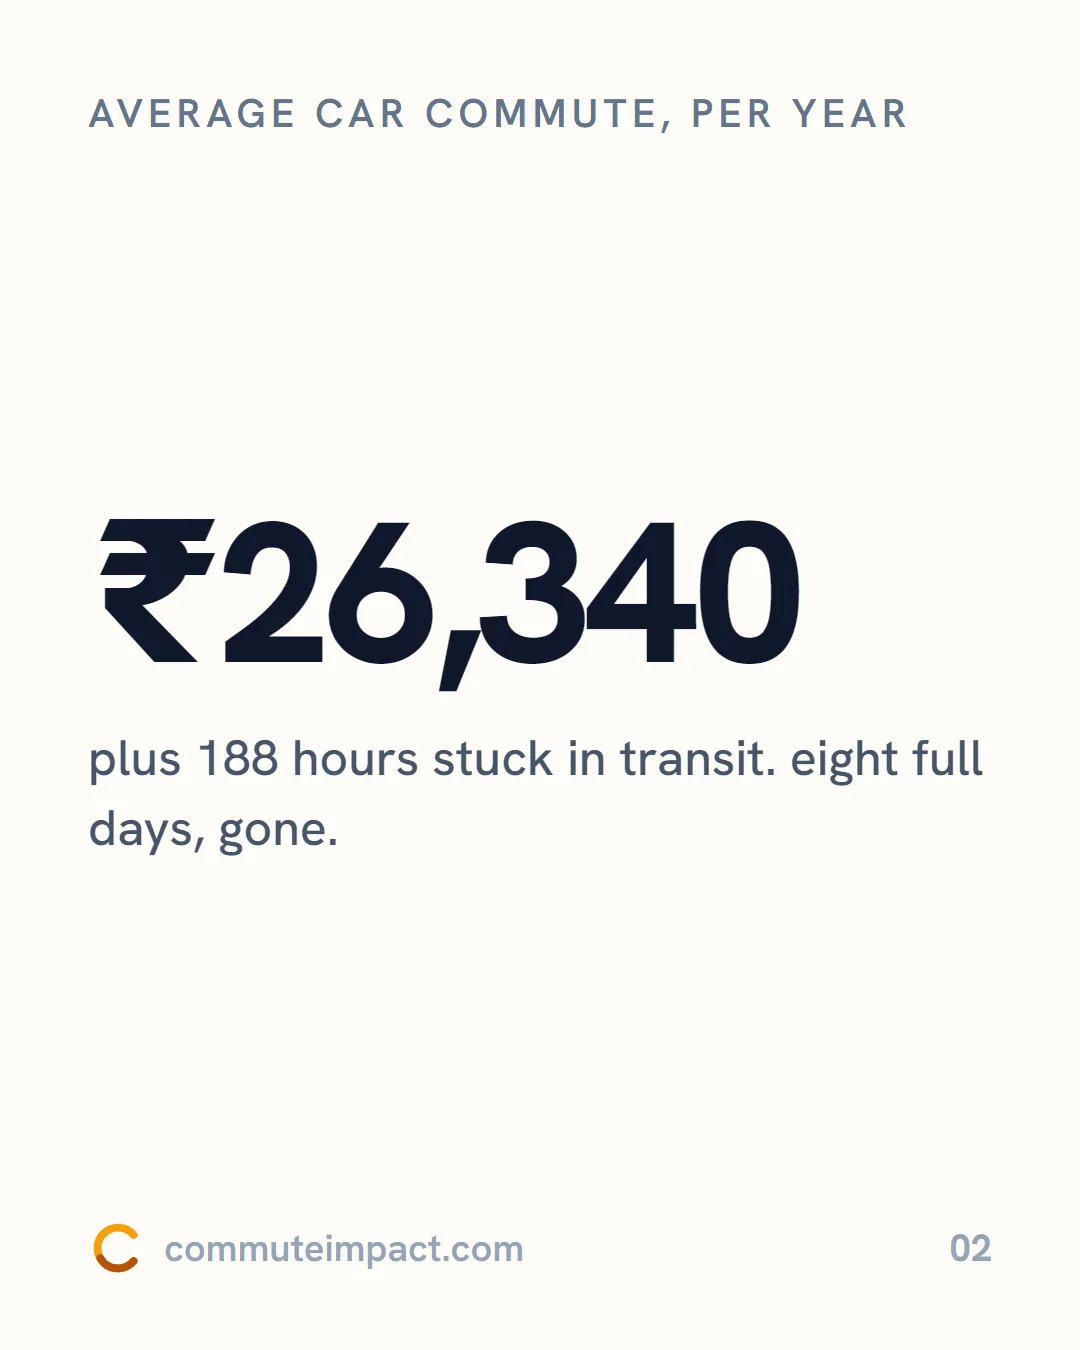
Average car commute, per year
₹26,340, plus 188 hours stuck in transit: almost eight full days.
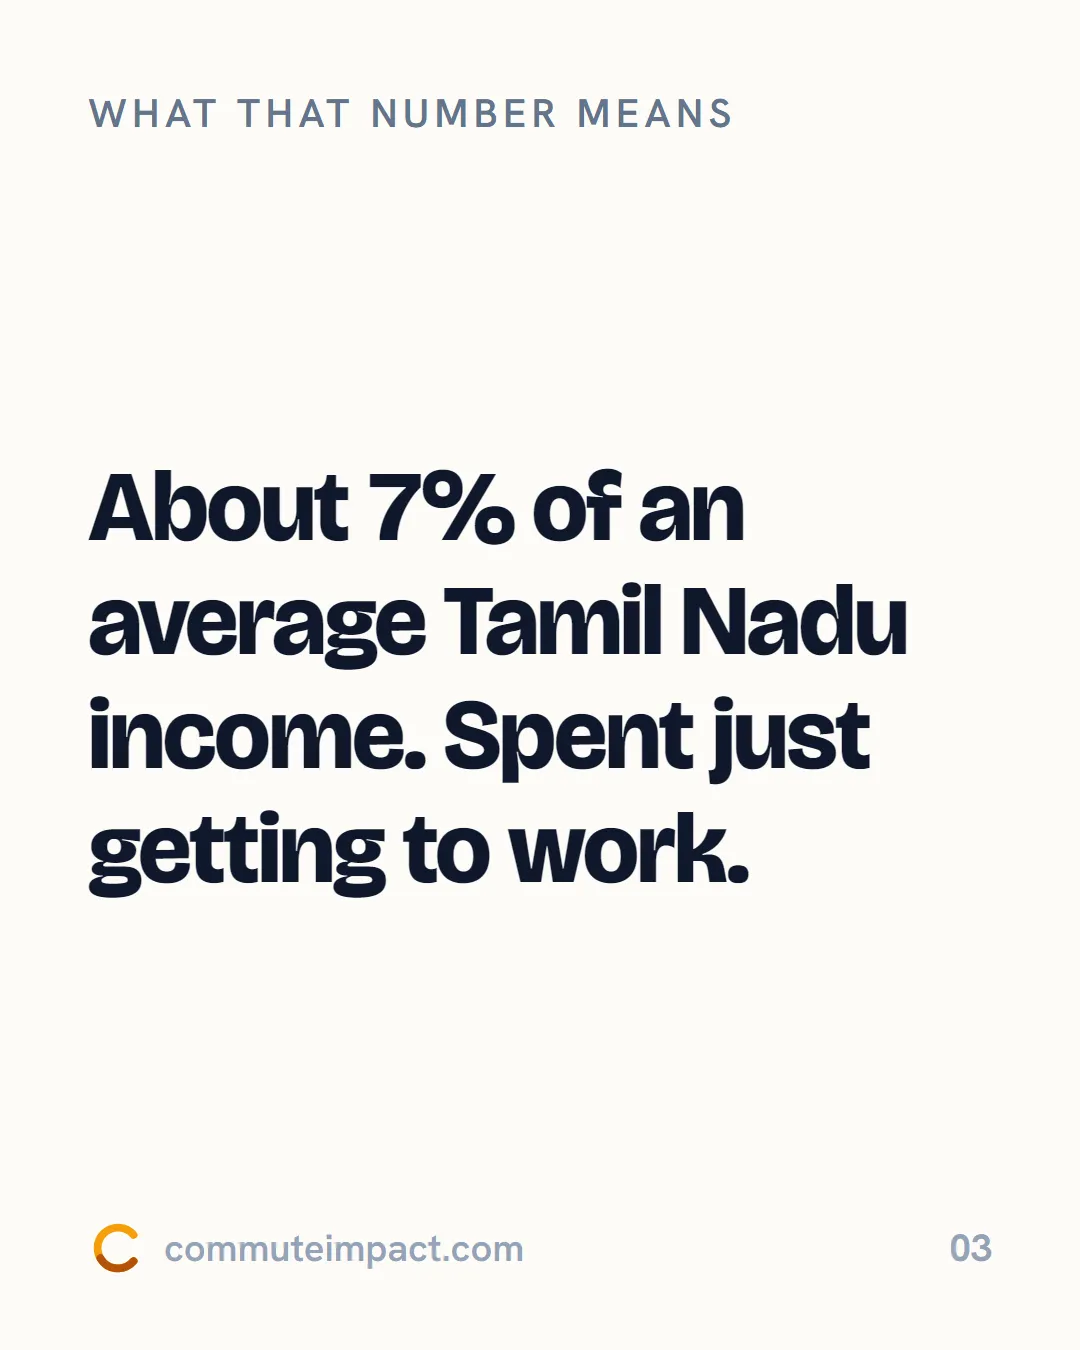
What that number means
About 7% of an average Tamil Nadu income, spent just getting to work.
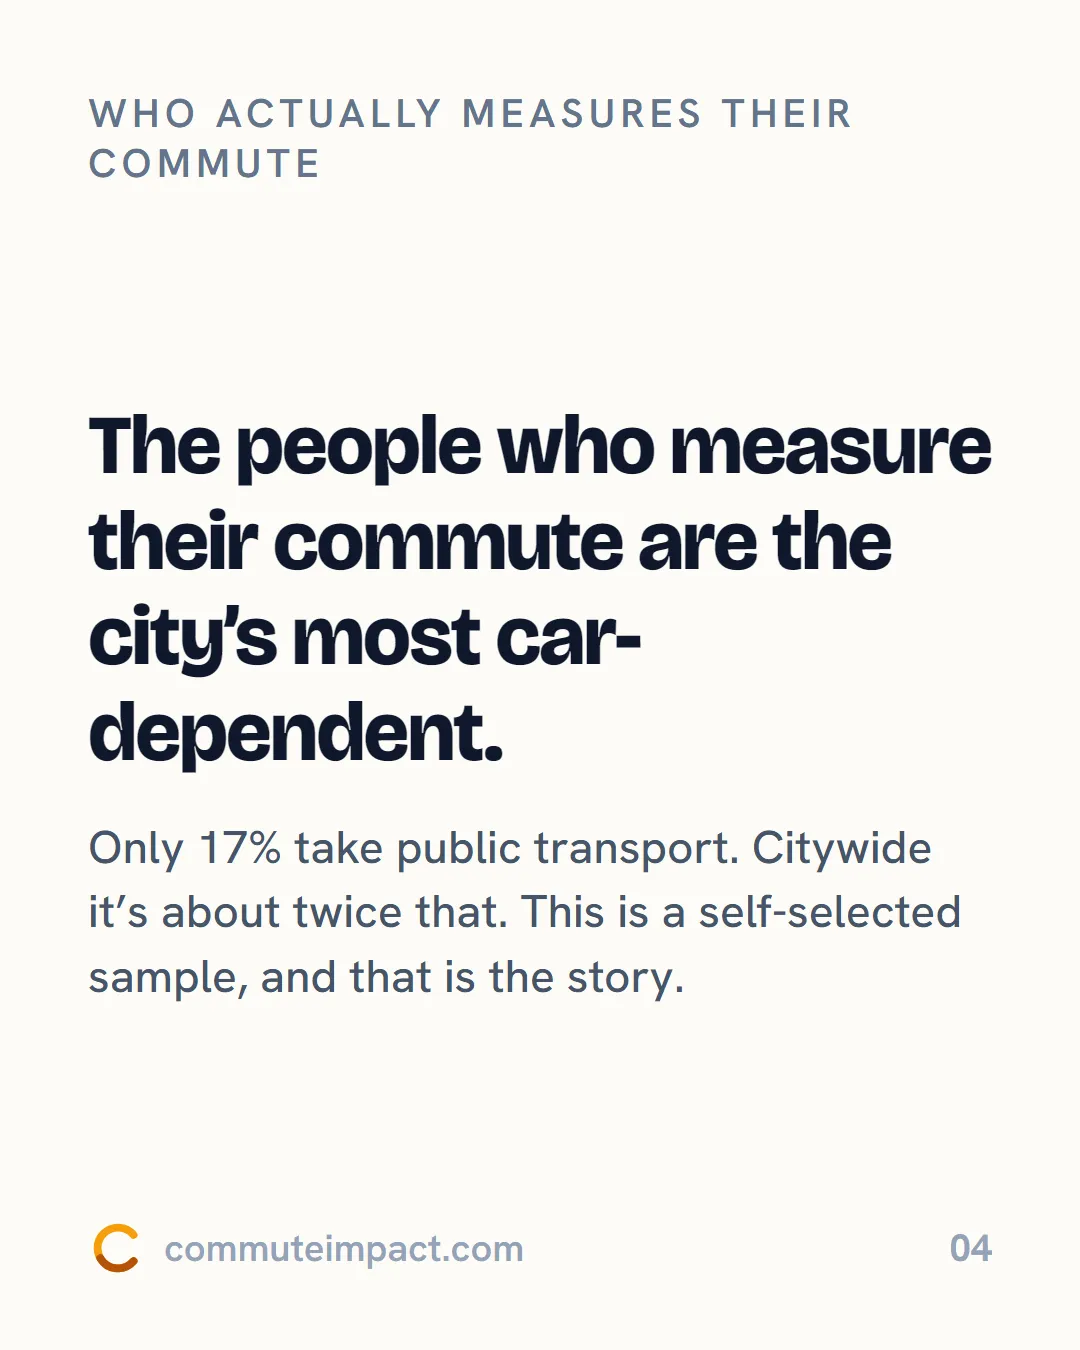
Who actually measures their commute
The people who measure their commute are the city’s most car-dependent.
Only 17% take public transport. Citywide it’s about twice that. This is a self-selected sample, and that is the story.
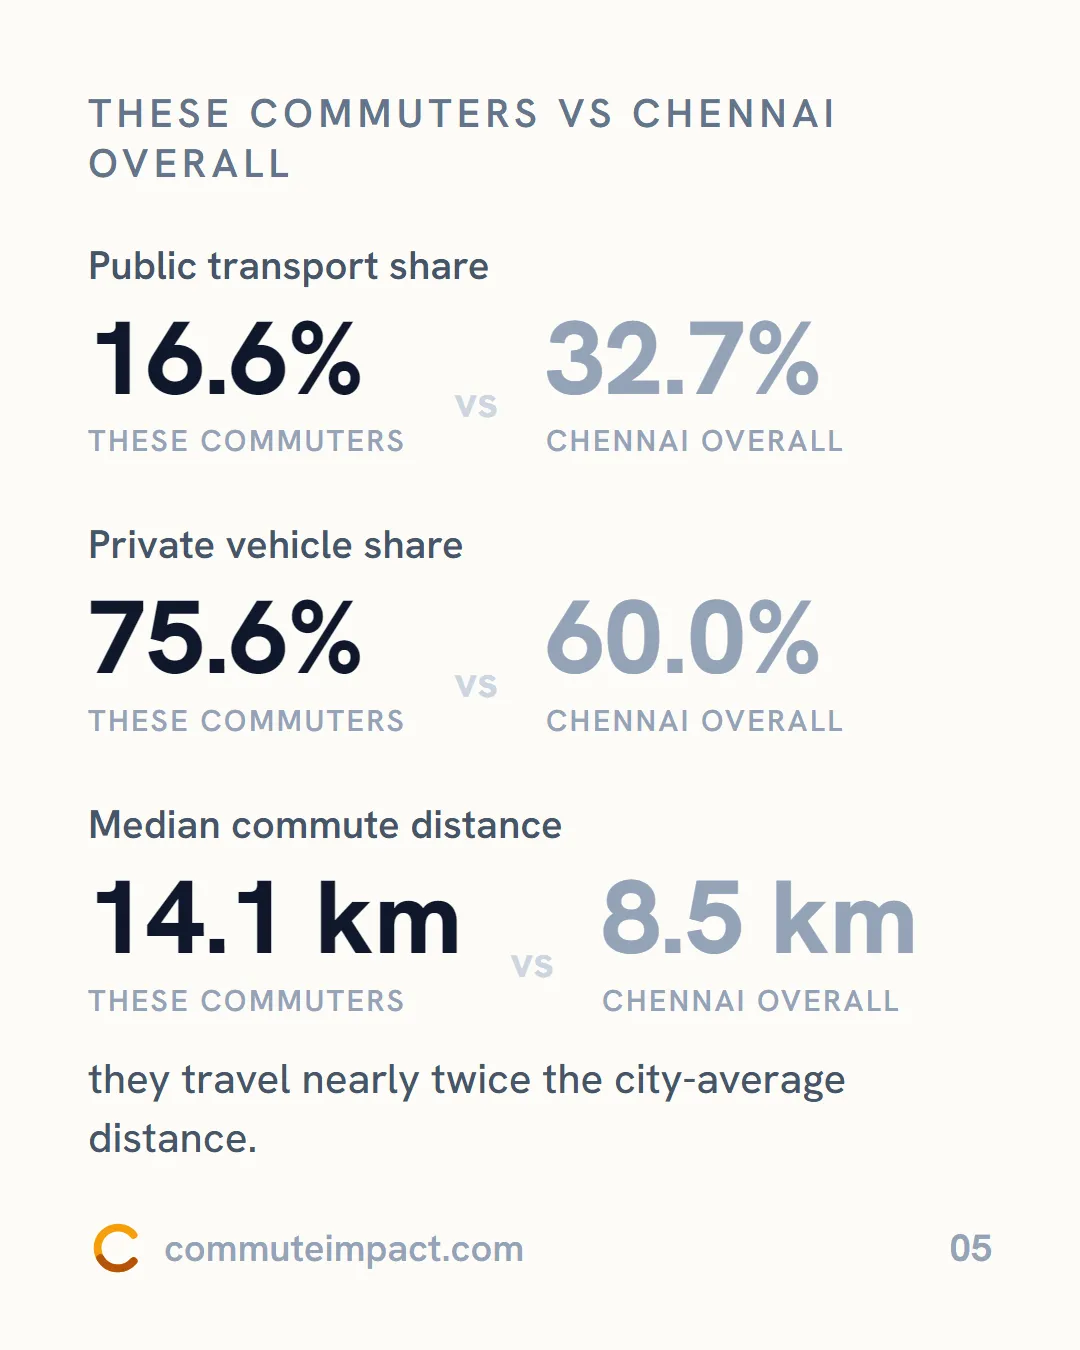
These commuters vs Chennai overall
| These commuters | Chennai overall | |
|---|---|---|
| Public transport share | 16.6% | 32.7% |
| Private vehicle share | 75.6% | 60.0% |
| Median commute distance | 14.1 km | 8.5 km |
They travel nearly twice the city-average distance.
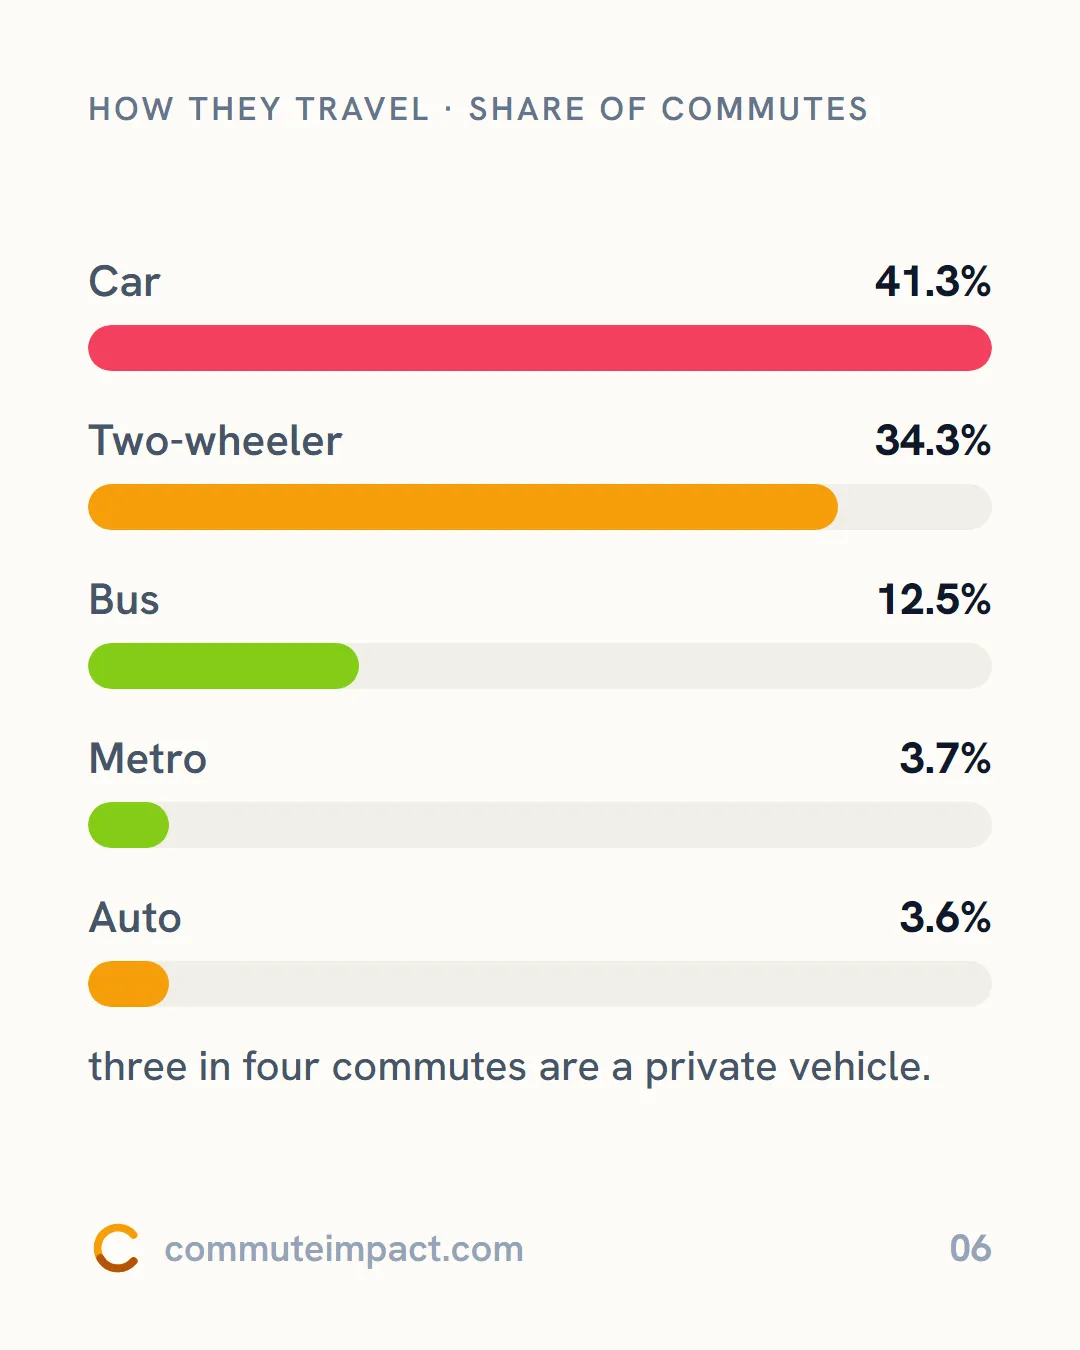
How they travel
Share of commutes
- Car 41.3%
- Two-wheeler 34.3%
- Bus 12.5%
- Metro 3.7%
- Auto 3.6%
Three in four commutes are a private vehicle.
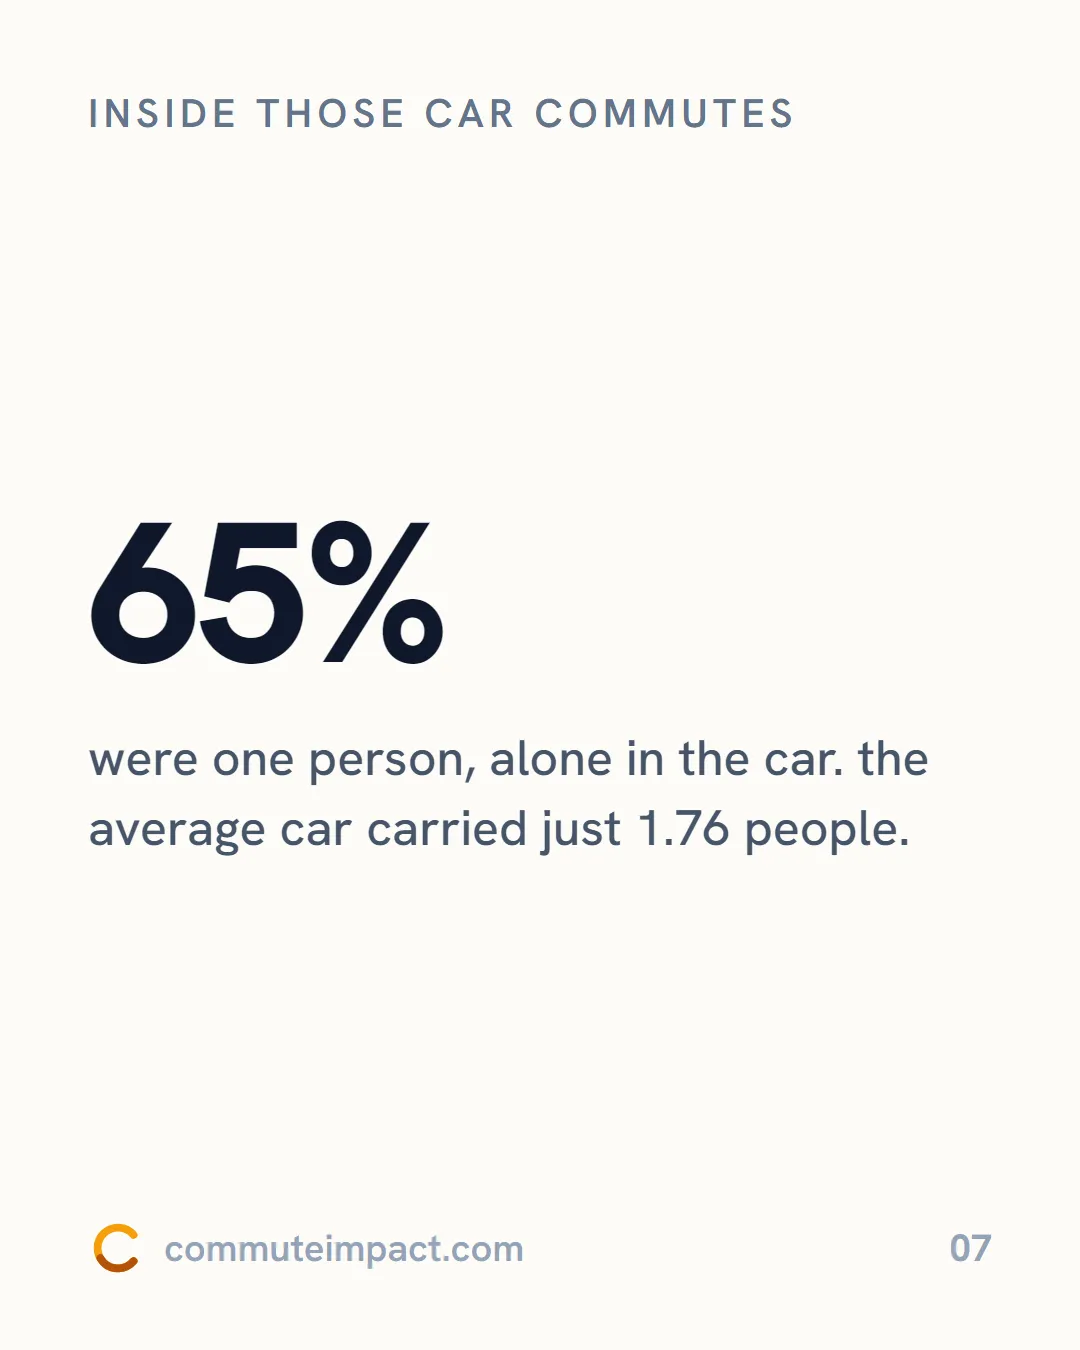
Inside those car commutes
65% were one person, alone in the car. The average car carried just 1.76 people.
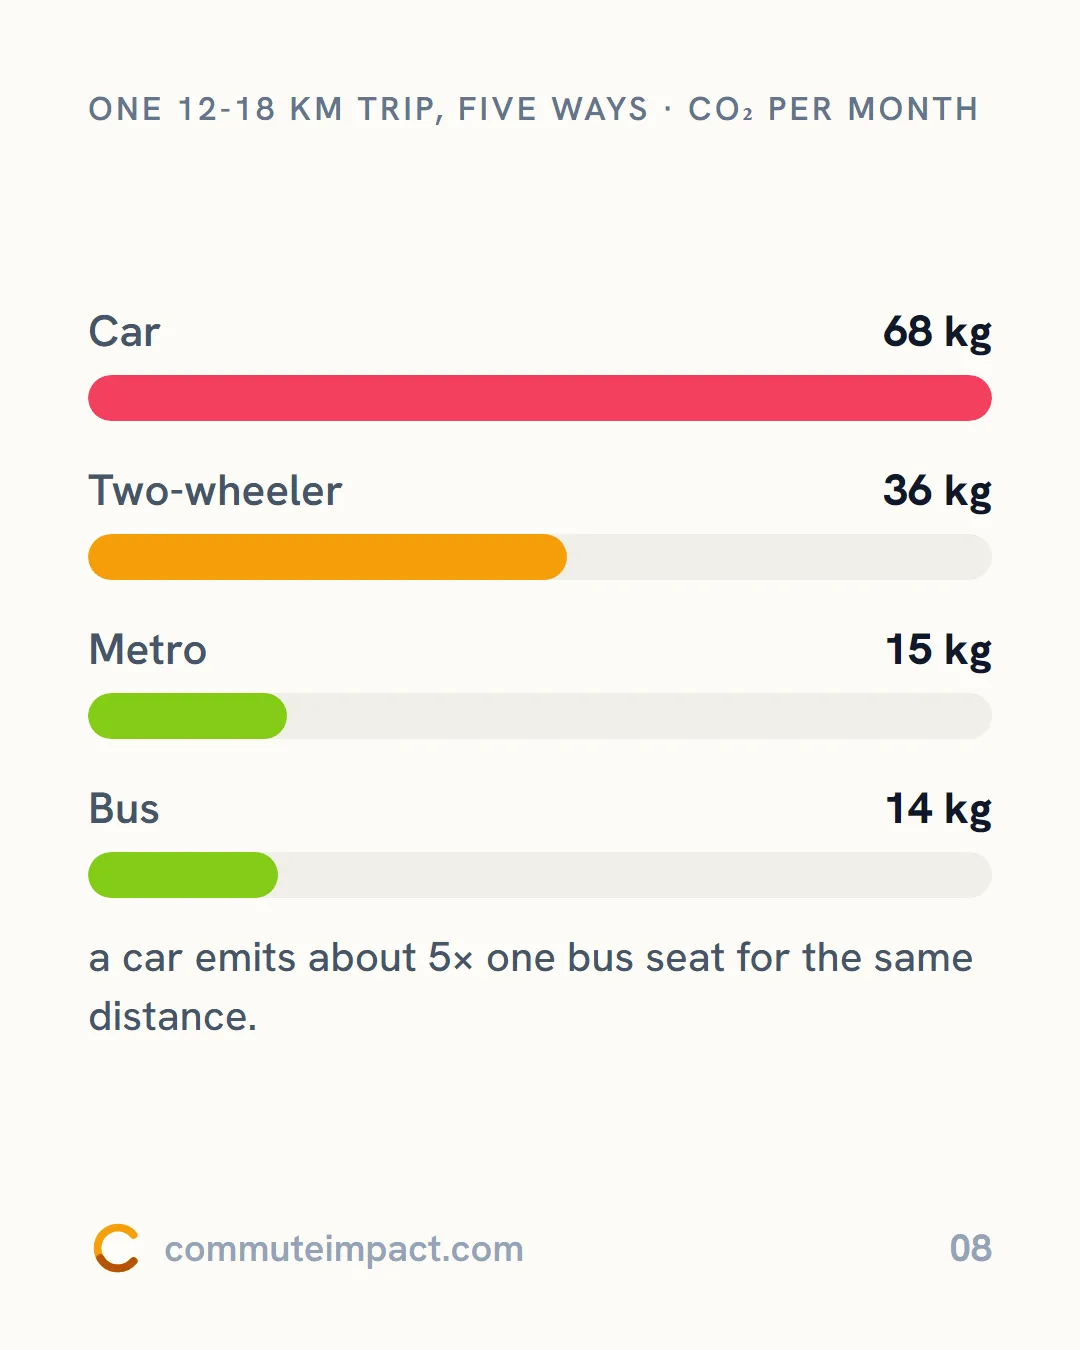
One 12-18 km trip, five ways
CO₂ per month
- Car 68 kg
- Two-wheeler 36 kg
- Metro 15 kg
- Bus 14 kg
A car emits about 5× one bus seat for the same distance.
The two-wheeler paradox
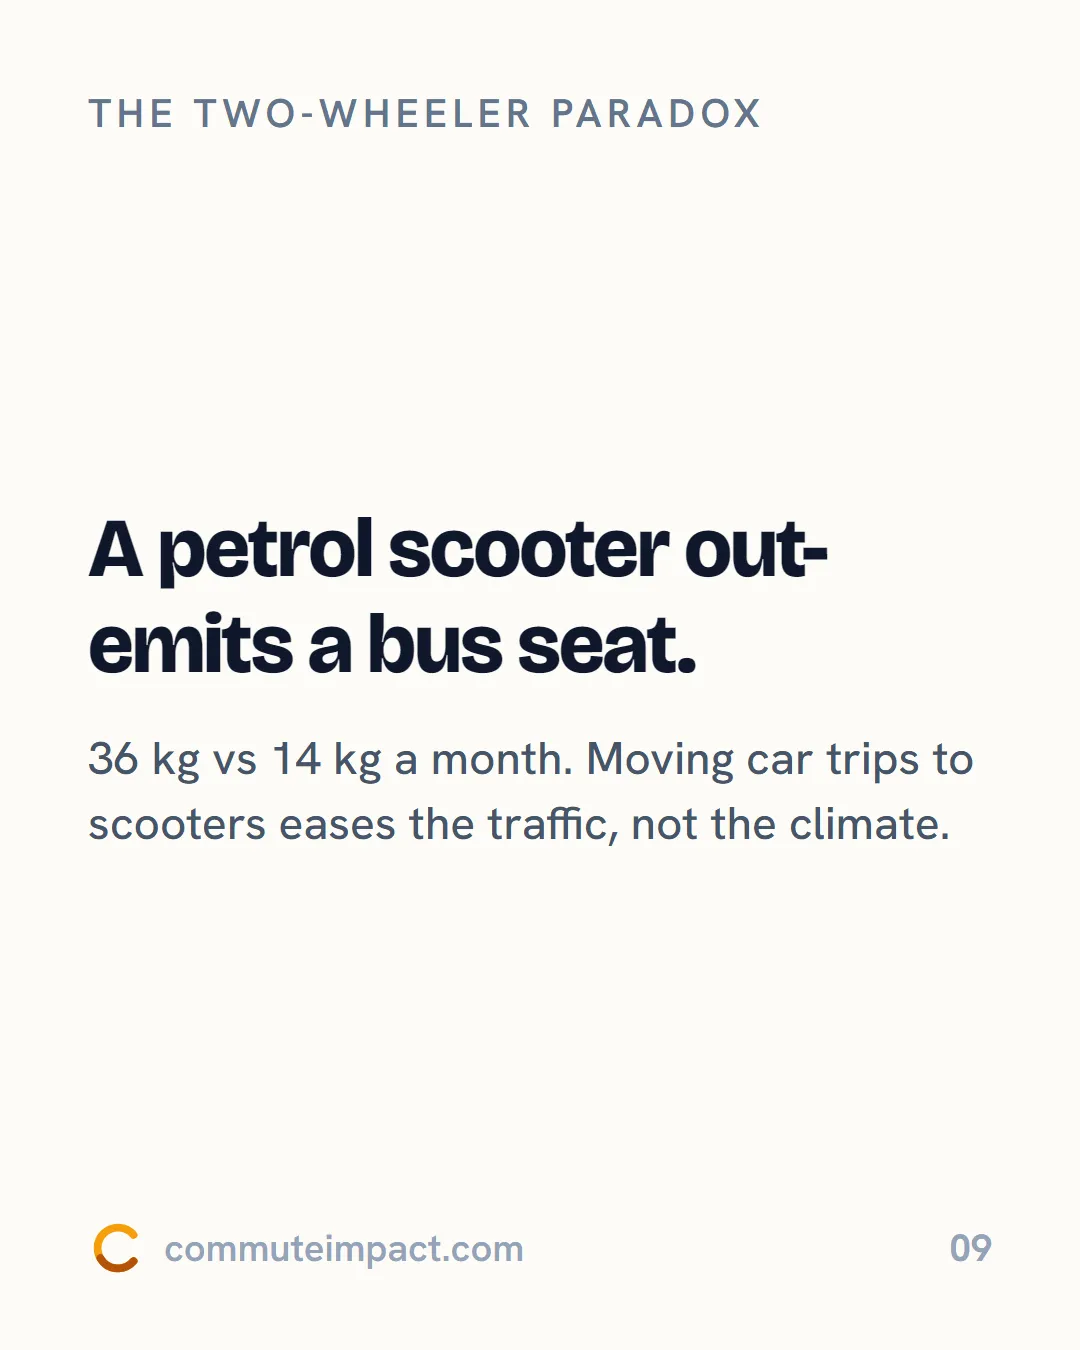
A petrol scooter out-emits a bus seat.
36 kg vs 14 kg a month. Moving car trips to scooters eases the traffic and roughly halves the CO₂, but a bus seat cuts it to about a fifth.
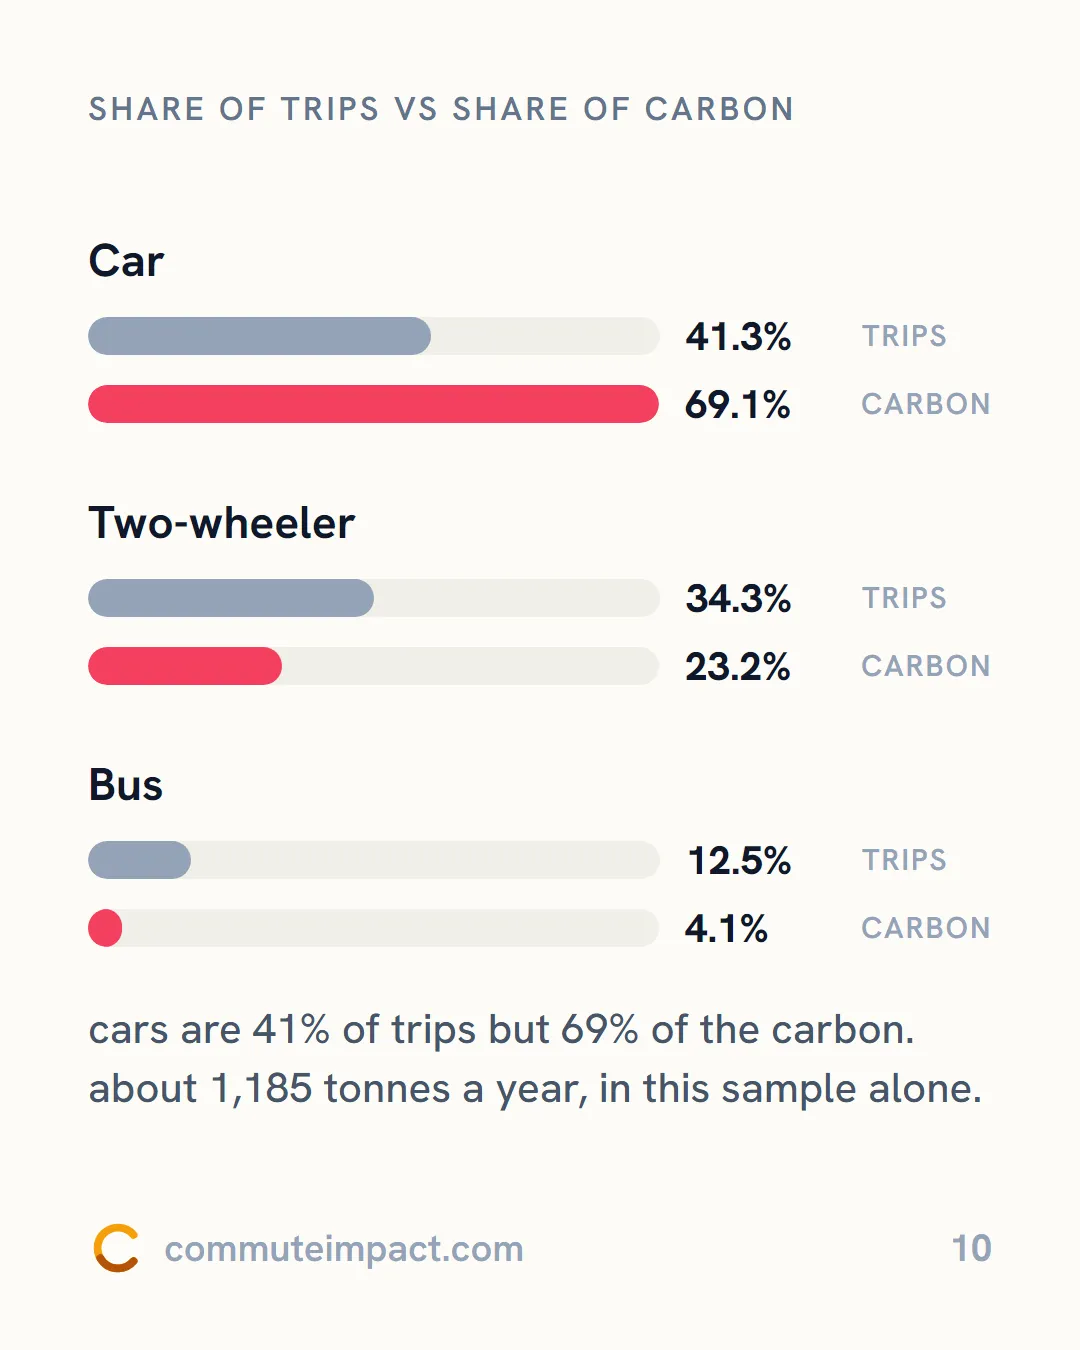
Share of trips vs share of carbon
| Mode | Trips | Carbon |
|---|---|---|
| Car | 41.3% | 69.1% |
| Two-wheeler | 34.3% | 23.2% |
| Bus | 12.5% | 4.1% |
Cars are 41% of trips but 69% of the carbon. About 1,185 tonnes a year, in this sample alone.
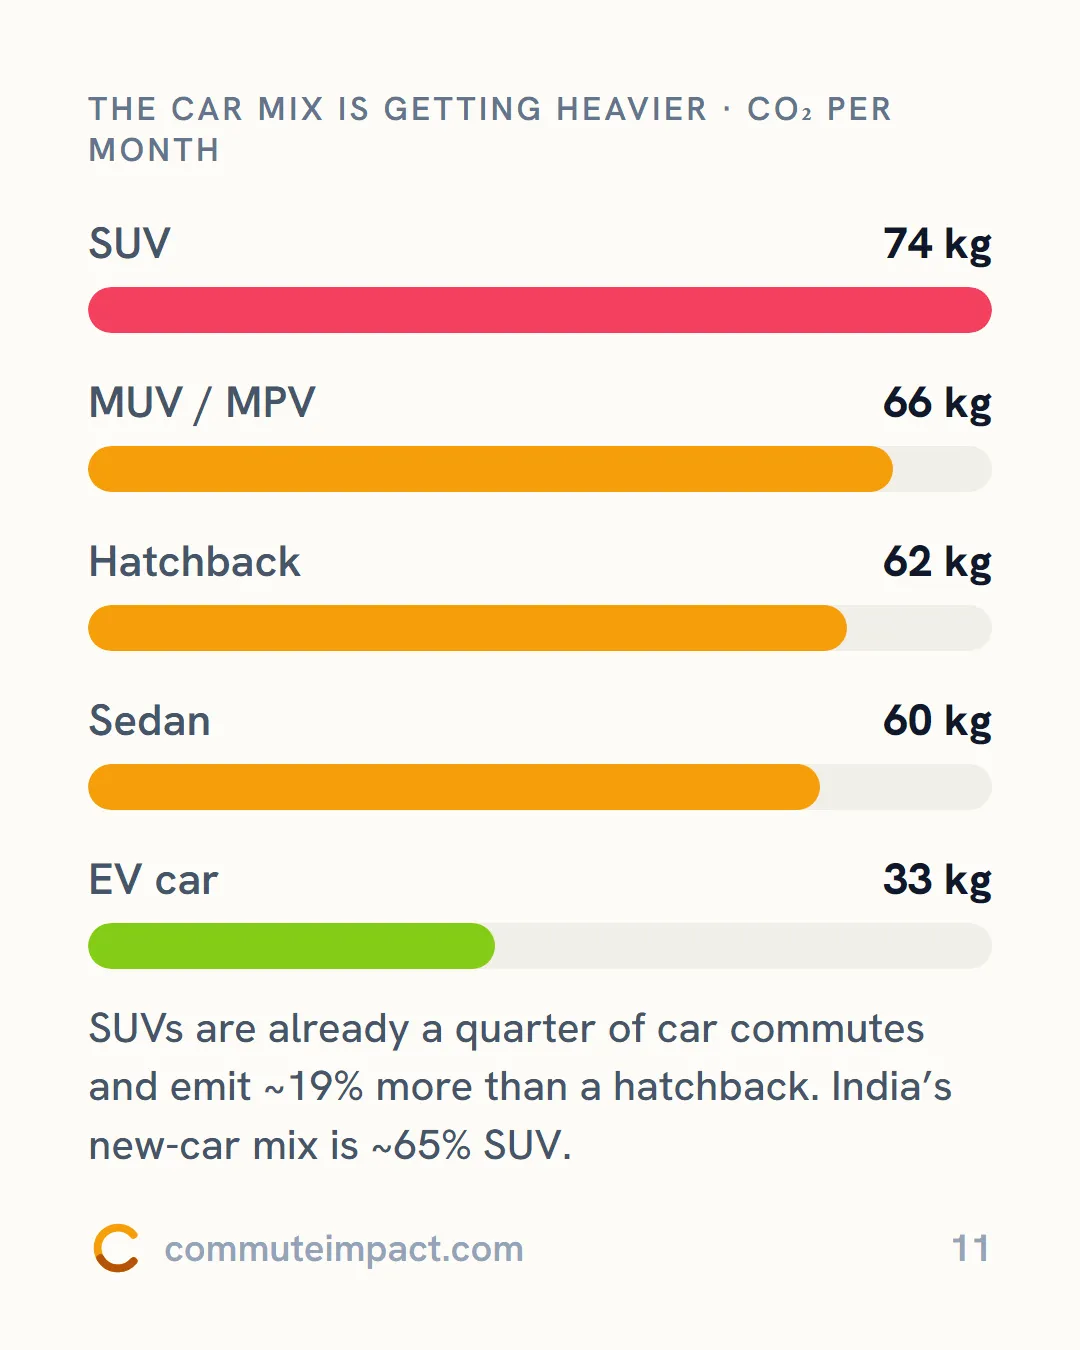
The car mix is getting heavier
CO₂ per month
- SUV 74 kg
- MUV / MPV 66 kg
- Hatchback 62 kg
- Sedan 60 kg
- EV car 33 kg
SUVs are already a quarter of car commutes and emit ~19% more than a hatchback. India’s new-car mix is ~65% SUV.
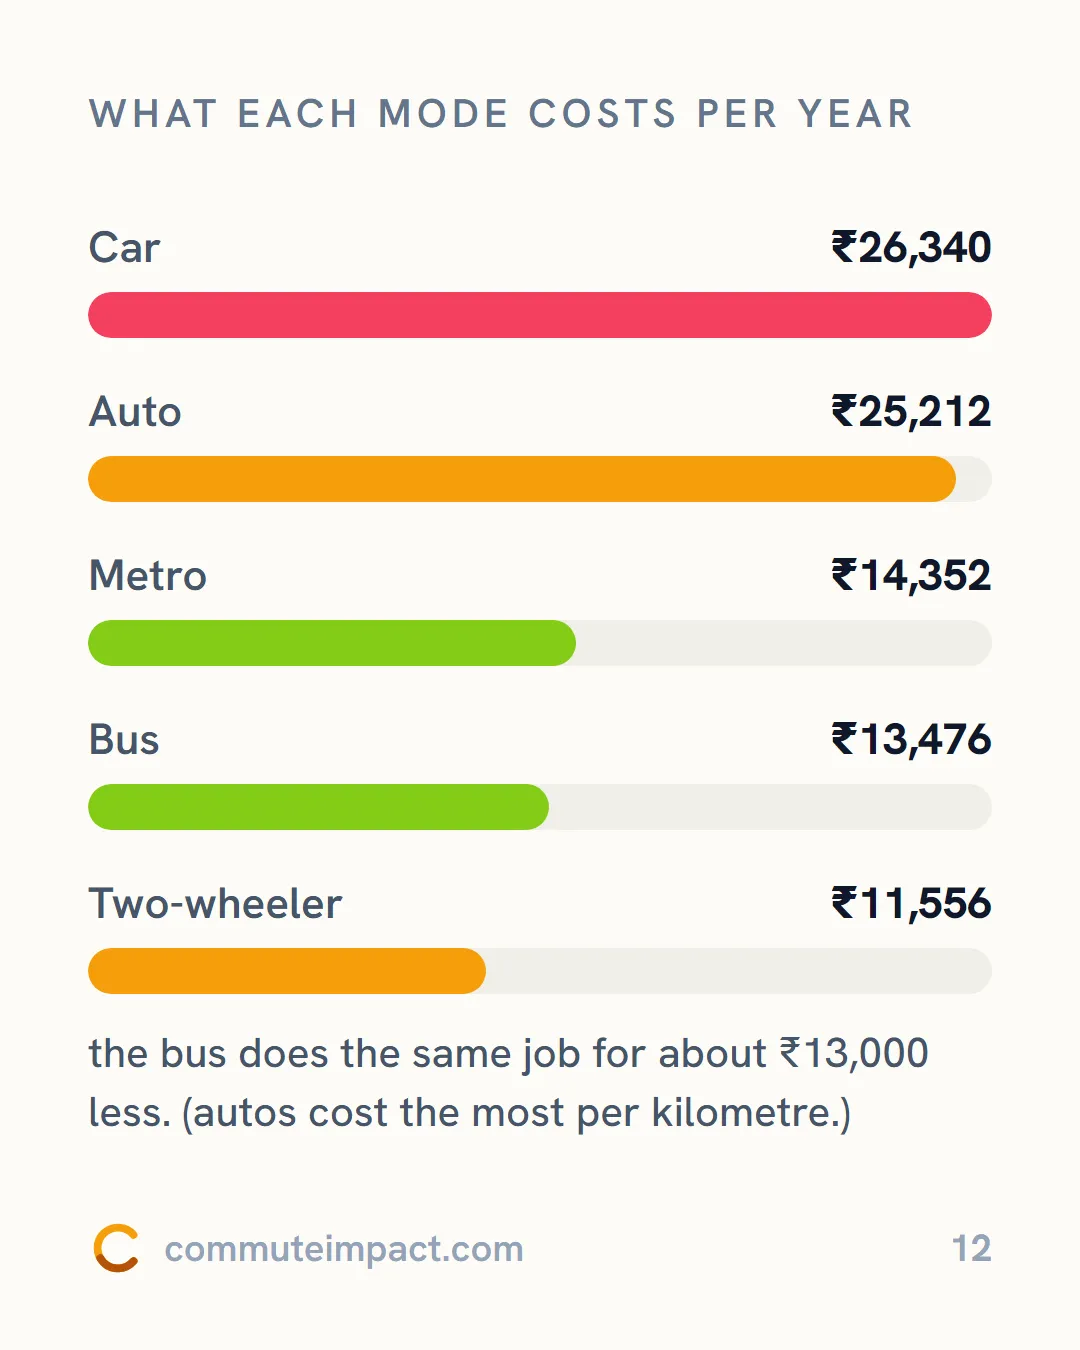
What each mode costs per year
- Car ₹26,340
- Auto ₹25,212
- Metro ₹14,352
- Bus ₹13,476
- Two-wheeler ₹11,556
The bus does the same job for about ₹13,000 less. (Autos cost the most per kilometre.)
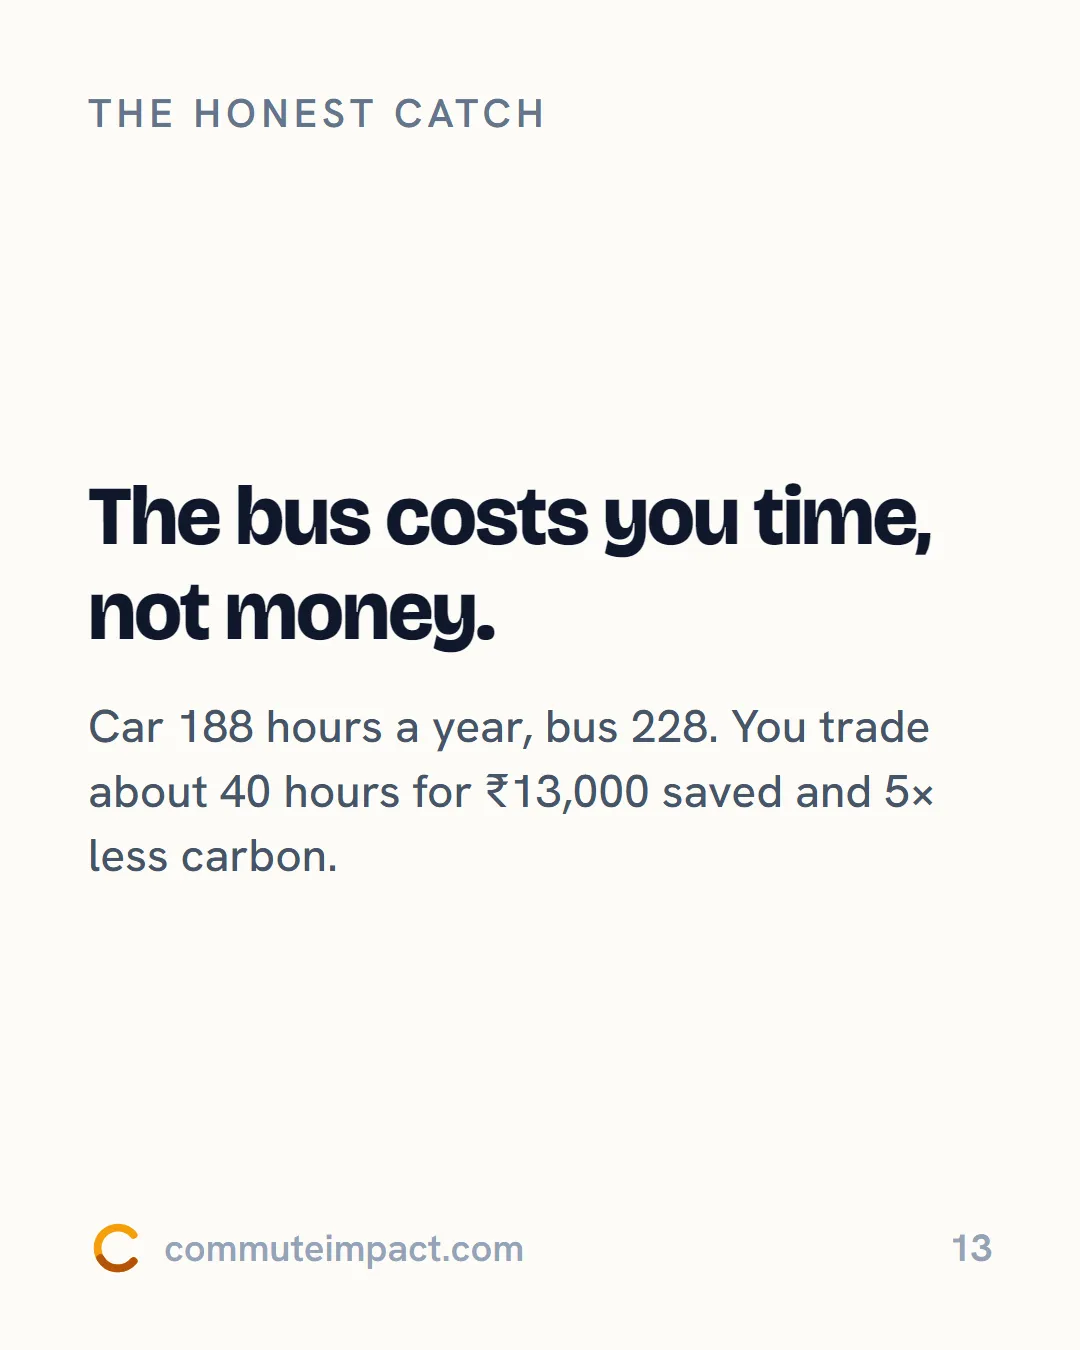
The honest catch
The bus saves you ₹13,000 a year and costs you 40 hours.
Car 188 hours a year, bus 228. You trade about 40 hours for ₹13,000 saved and 5× less carbon.
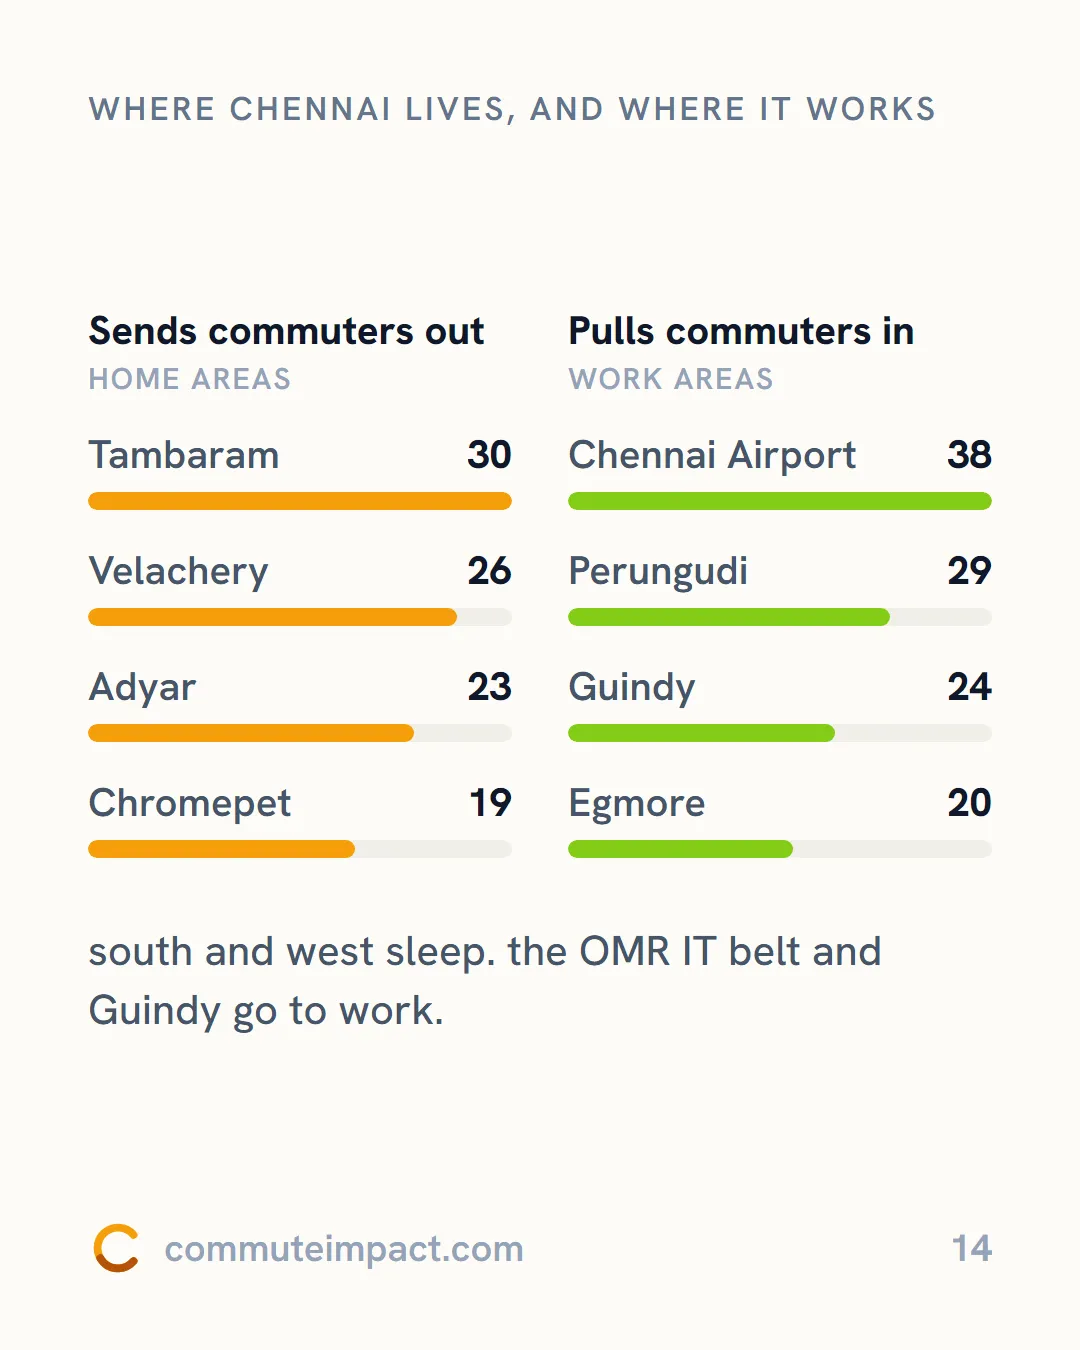
Where Chennai lives, and where it works
Sends commuters out (home areas): Tambaram 30, Velachery 26, Adyar 23, Chromepet 19.
Pulls commuters in (work areas): Chennai Airport 38, Perungudi 29, Guindy 24, Egmore 20.
Chennai lives in the south and west, and works along the OMR IT belt and in Guindy.
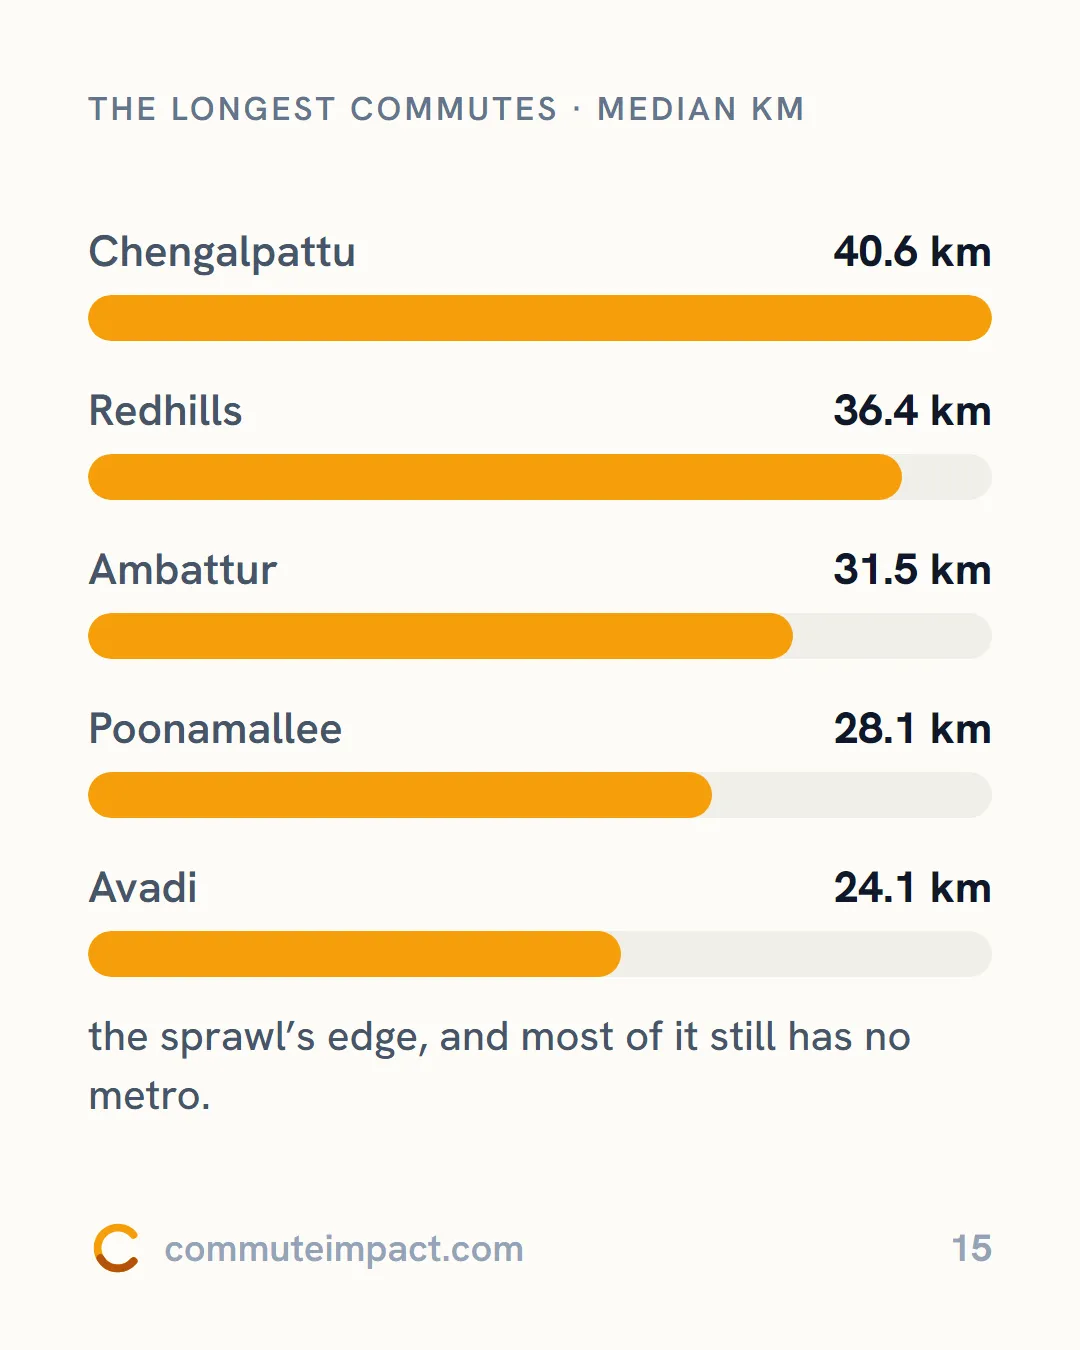
The longest commutes
Median km
- Chengalpattu 40.6 km
- Redhills 36.4 km
- Ambattur 31.5 km
- Poonamallee 28.1 km
- Avadi 24.1 km
The sprawl’s edge, and most of it still has no metro.
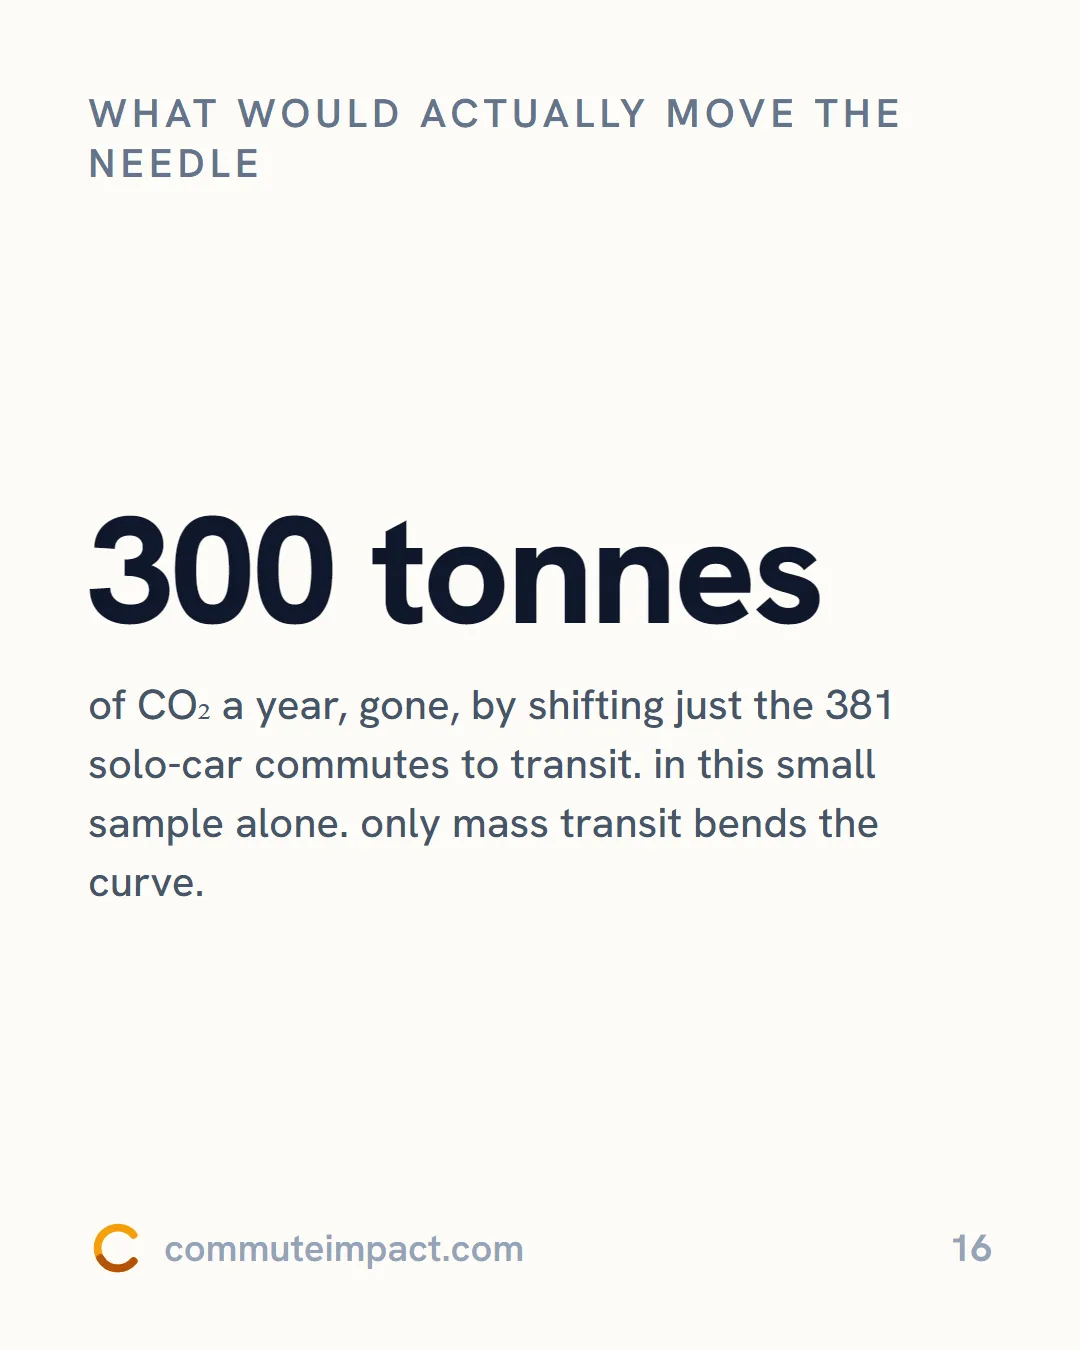
What would actually cut the carbon
300 tonnes of CO₂ a year would go if just the 381 solo-car commutes shifted to transit, in this small sample alone. Only mass transit cuts emissions at that scale.
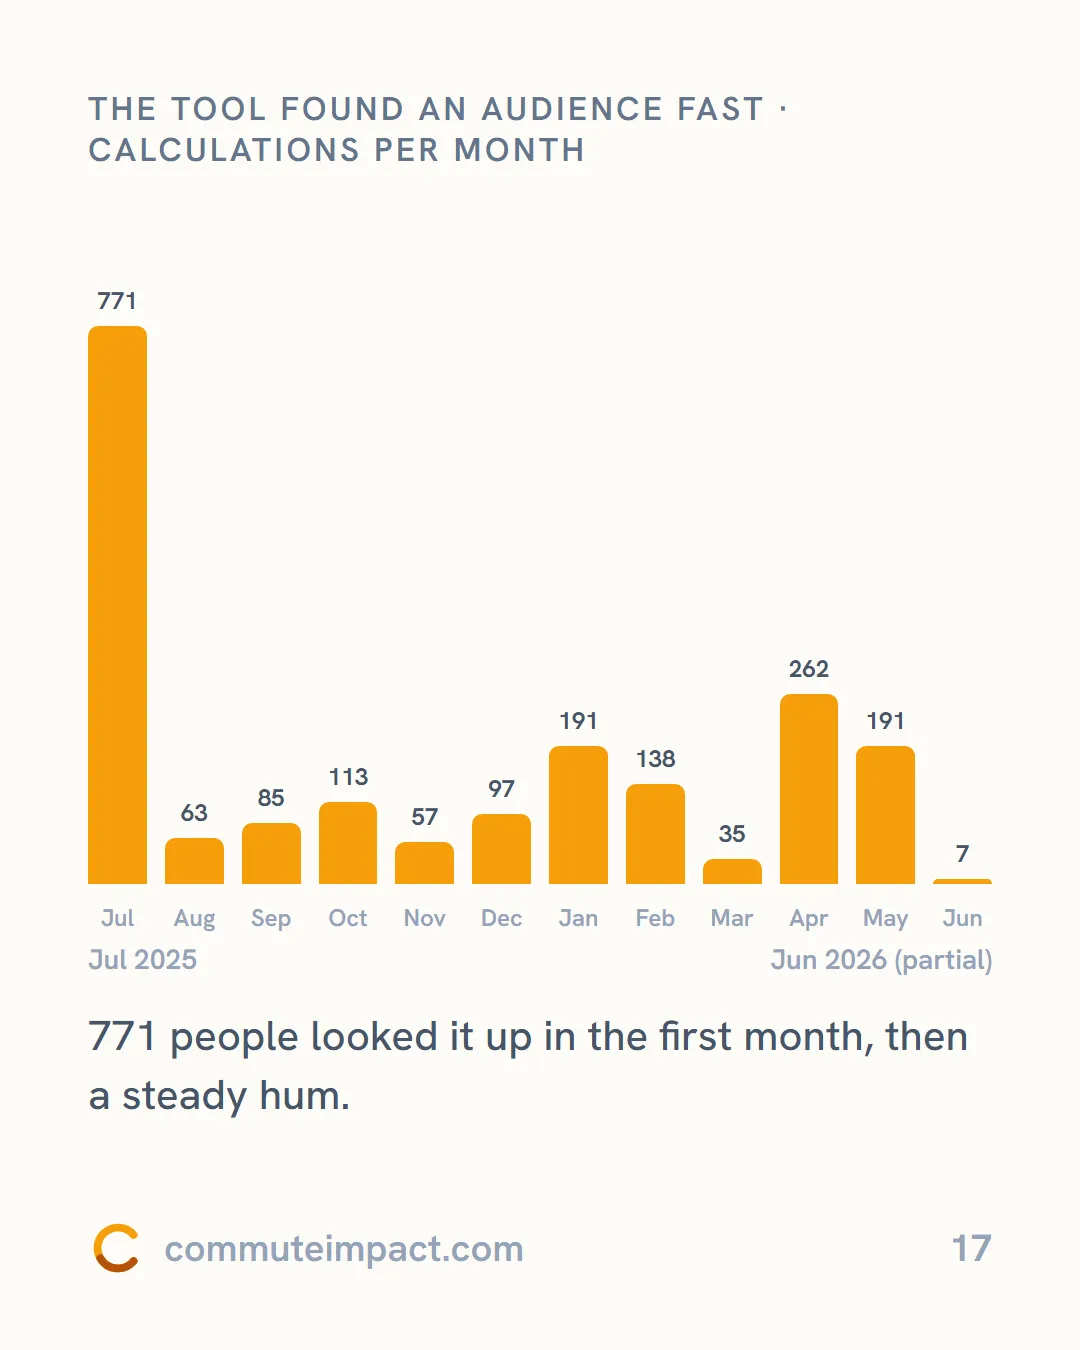
The tool found an audience fast
Calculations per month, Jul 2025 to Jun 2026 (partial)
| Month | Calculations |
|---|---|
| Jul | 771 |
| Aug | 63 |
| Sep | 85 |
| Oct | 113 |
| Nov | 57 |
| Dec | 97 |
| Jan | 191 |
| Feb | 138 |
| Mar | 35 |
| Apr | 262 |
| May | 191 |
| Jun | 7 |
771 people looked it up in the first month. Since then it has drawn between 35 and 262 a month.
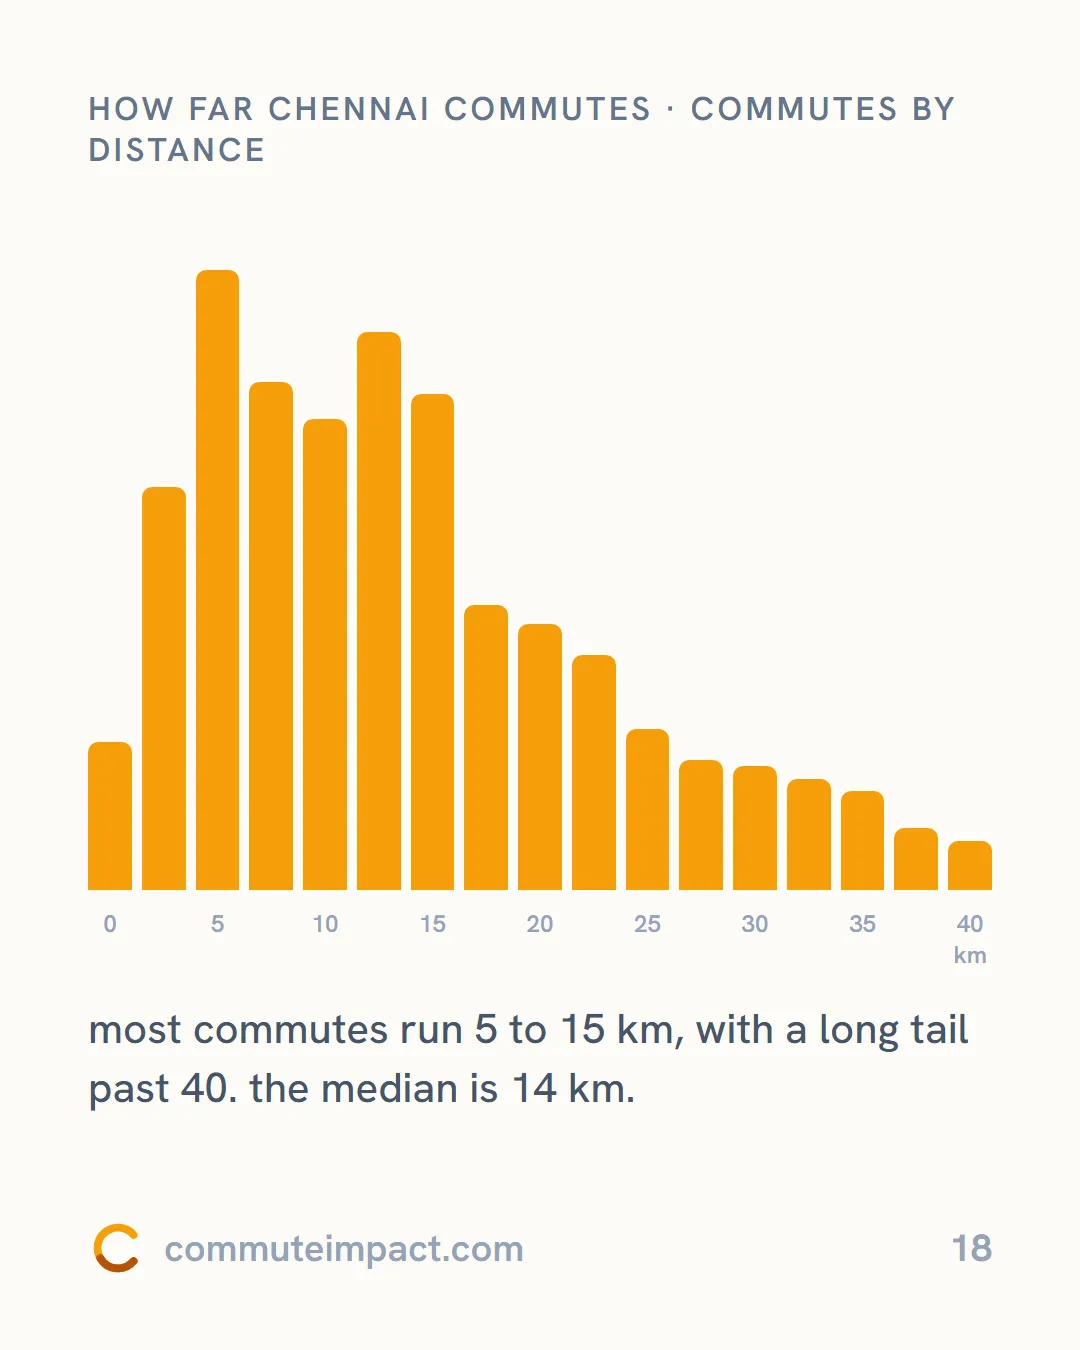
How far Chennai commutes
Commutes by distance
Most commutes run 5 to 15 km, with a long tail past 40. The median is 14 km.
Your turn
Find your number
The calculator’s free. commuteimpact.com