Bengaluru's traffic is a geometry problem

Read the deck as text
Bengaluru Commute Report
500+ real commutes · two weeks · one map
What this is
Everyone counts the cars. Almost no one asks how much road each one takes.
538 people in Bengaluru ran their own commute through the tool over two weeks. They picked themselves, so this is a snapshot, not the whole city. The shape it makes is hard to miss.
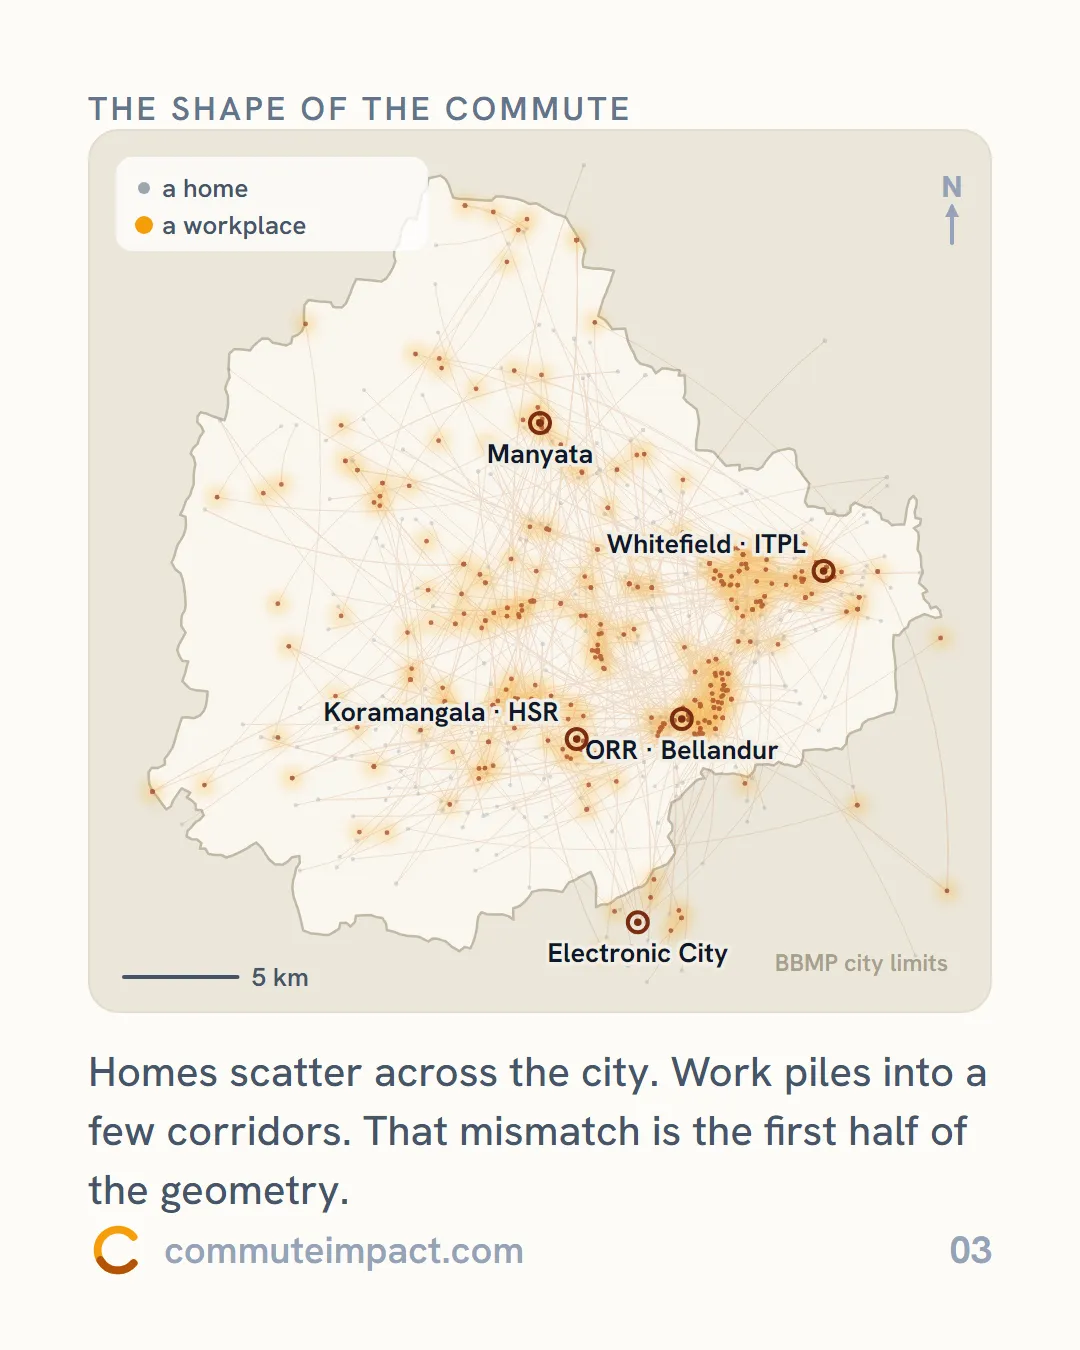
The shape of the commute
Homes scatter across the city, but work piles into five corridors. That mismatch is the first half of the geometry.
- Manyata
- Whitefield · ITPL
- Koramangala · HSR
- ORR · Bellandur
- Electronic City
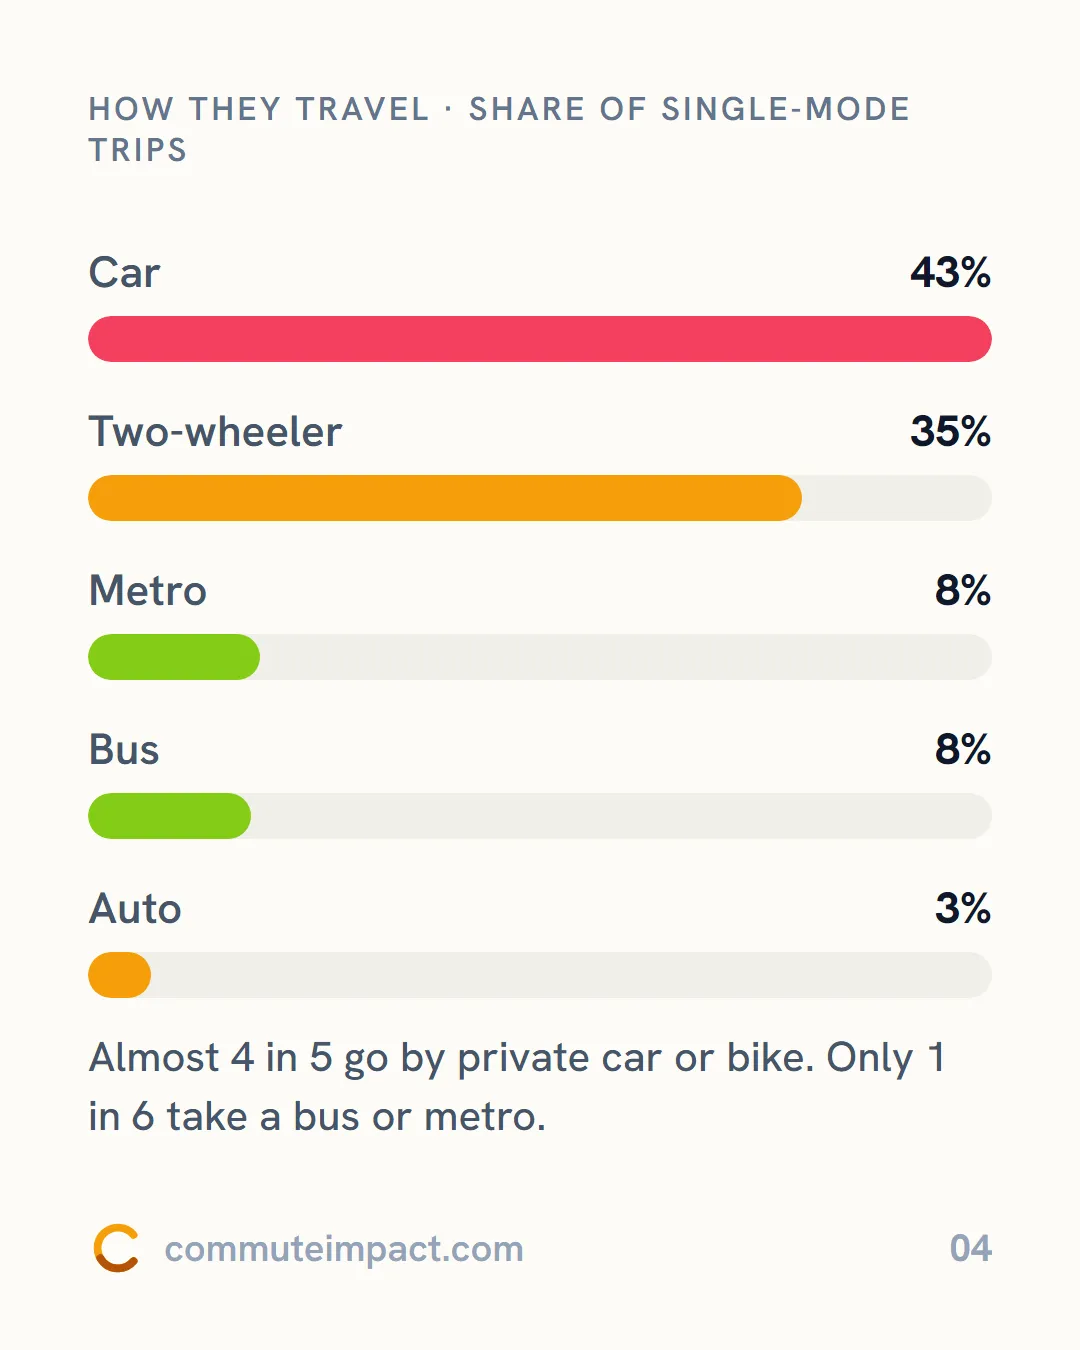
How they travel
Share of single-mode trips
- Car 43%
- Two-wheeler 35%
- Metro 8%
- Bus 8%
- Auto 3%
Almost 4 in 5 go by private car or bike. Only 1 in 6 take a bus or metro.
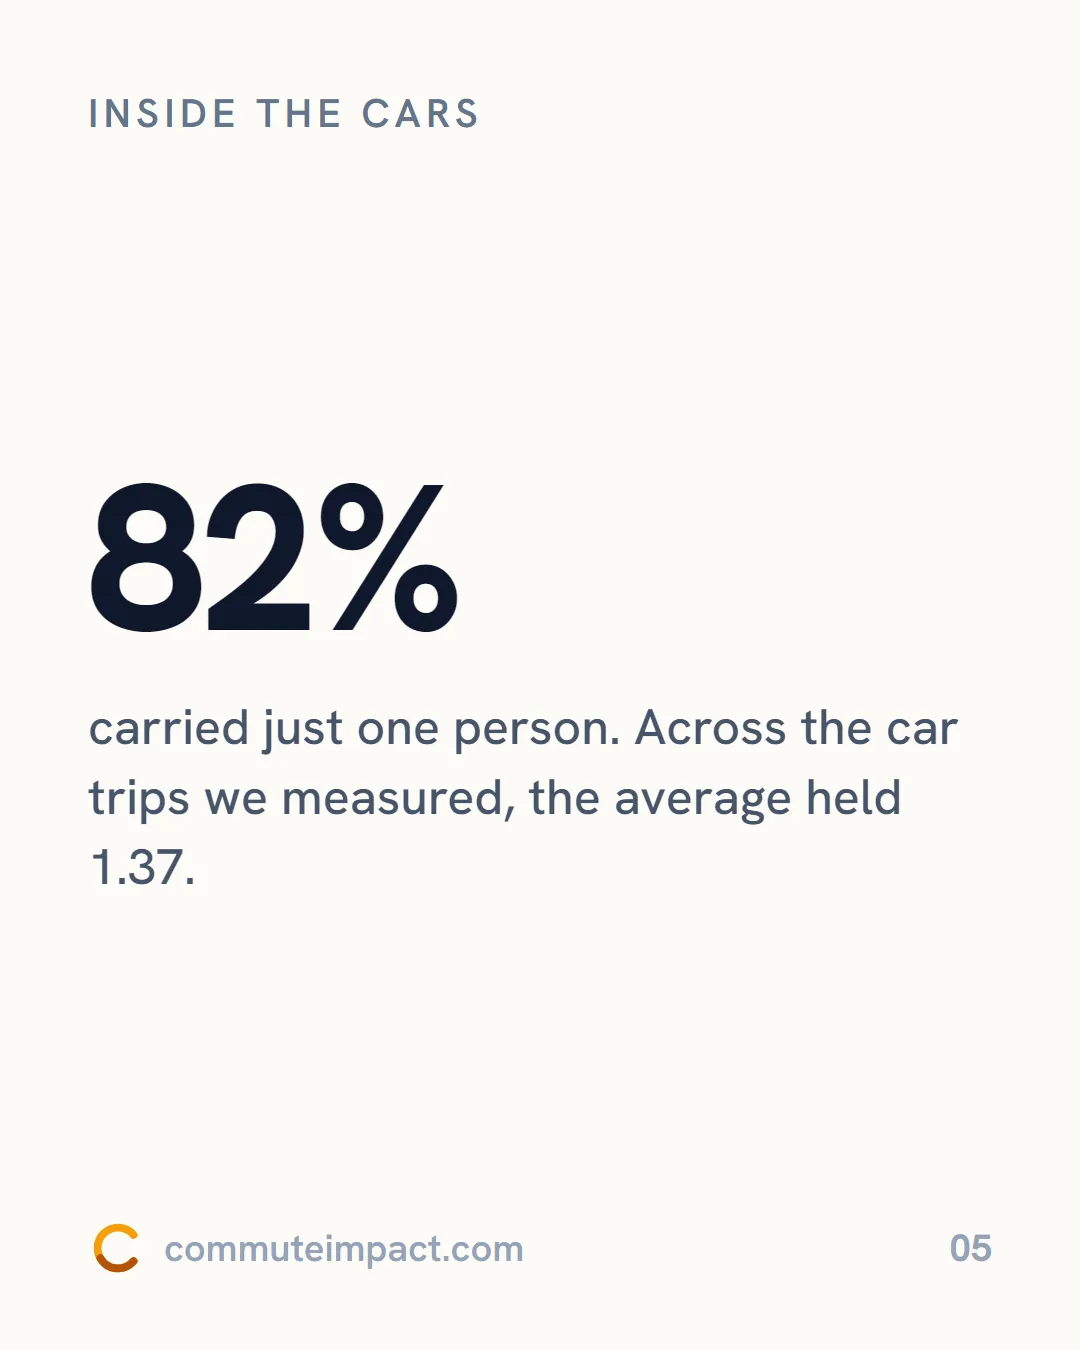
Inside the cars
82% carried just one person. Across the car trips we measured, the average held 1.37.
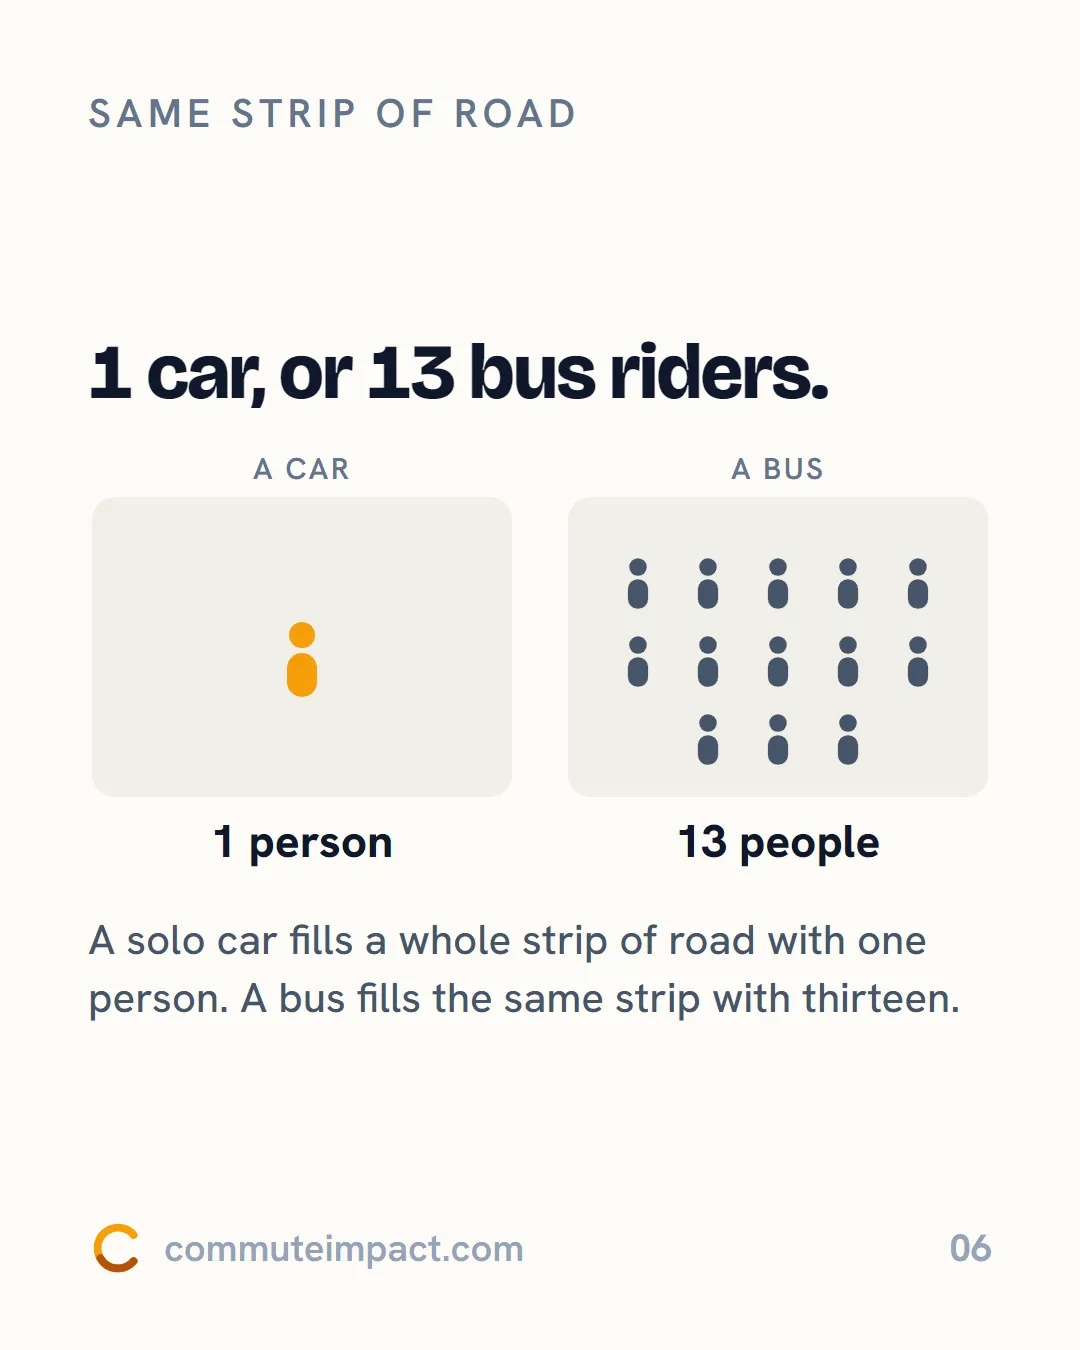
Same strip of road
1 car, or 13 bus riders.
- A car: 1 person
- A bus: 13 people
A solo car fills a whole strip of road with one person. A bus fills the same strip with thirteen.
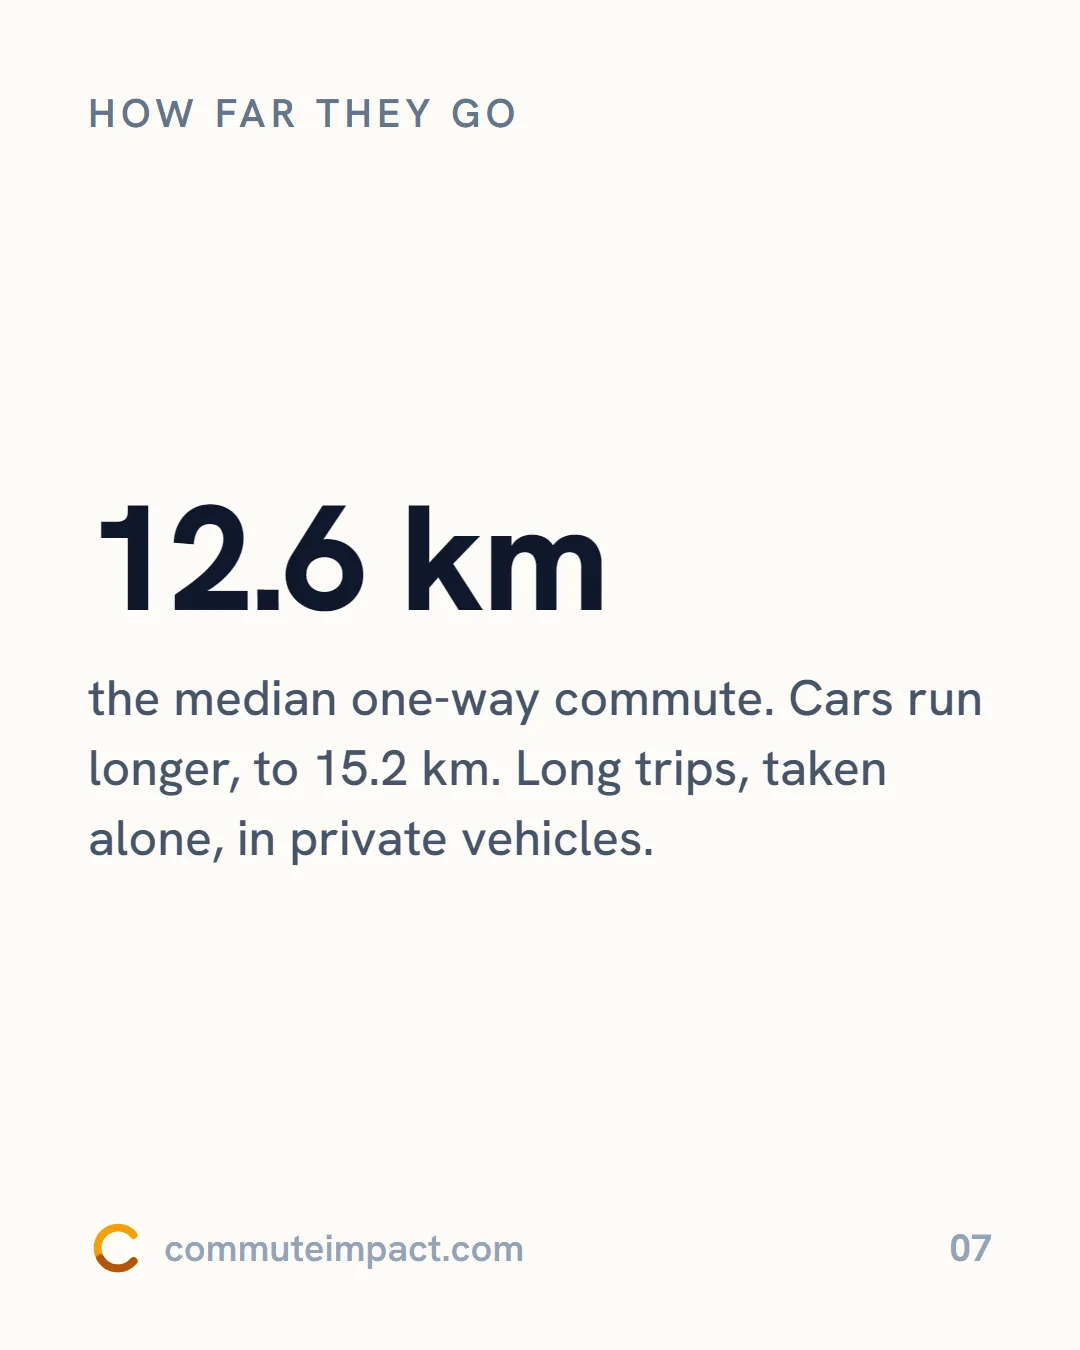
How far they go
12.6 km, the median one-way commute. Cars run longer, to 15.2 km. These are long trips, mostly taken alone in private vehicles.
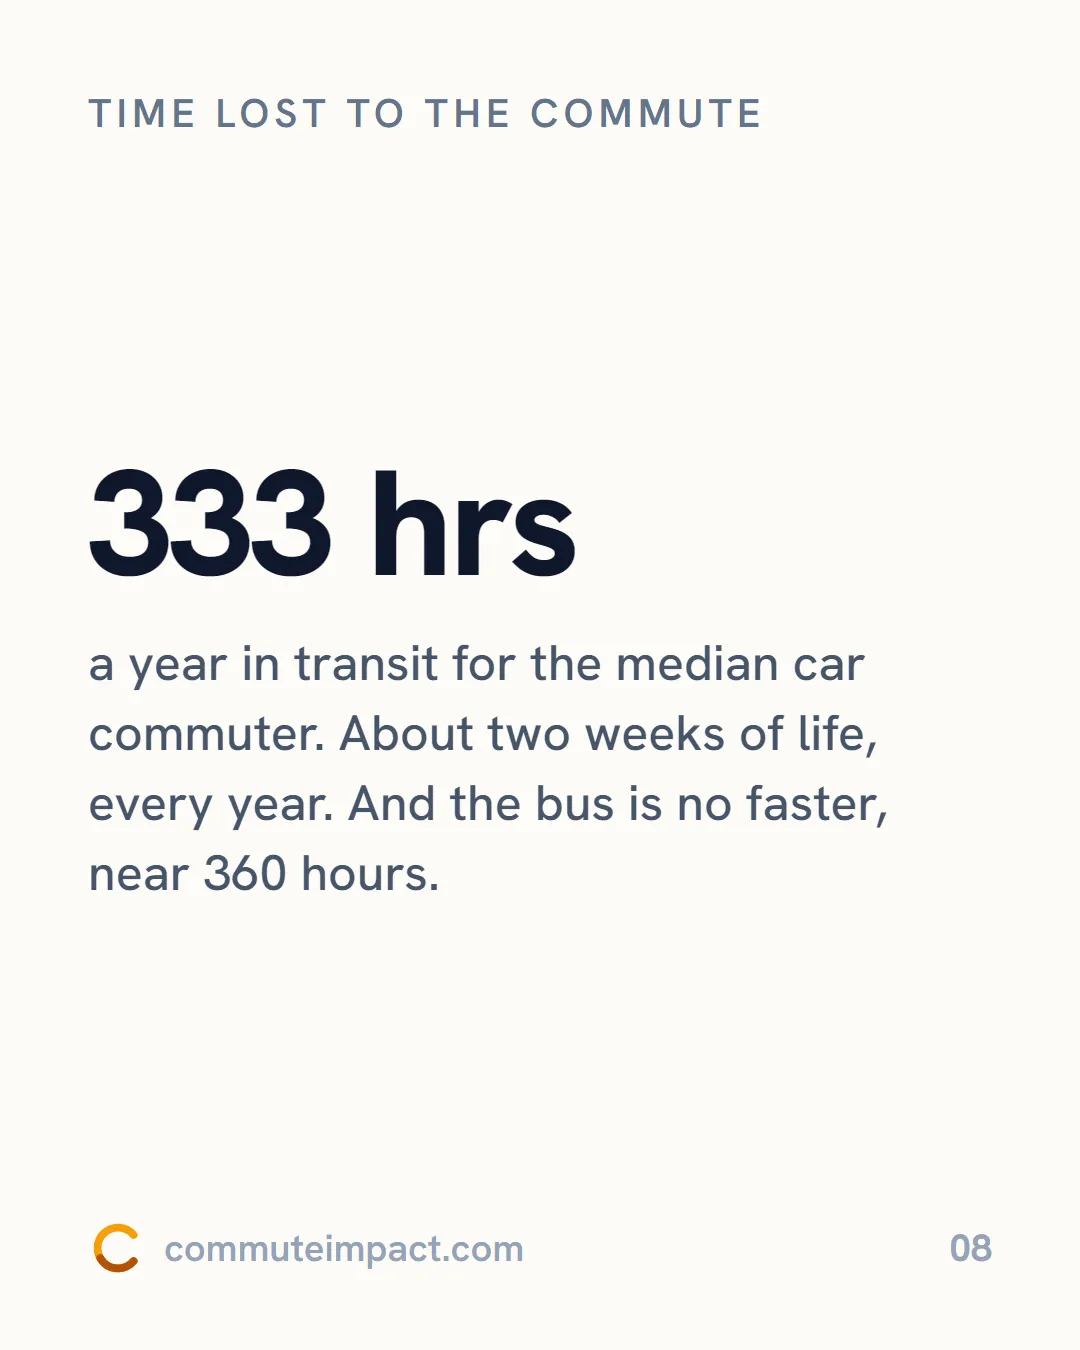
Time lost to the commute
333 hrs a year in transit for the median car commuter. That is about two weeks of every year. And the bus is no faster, near 360 hours.
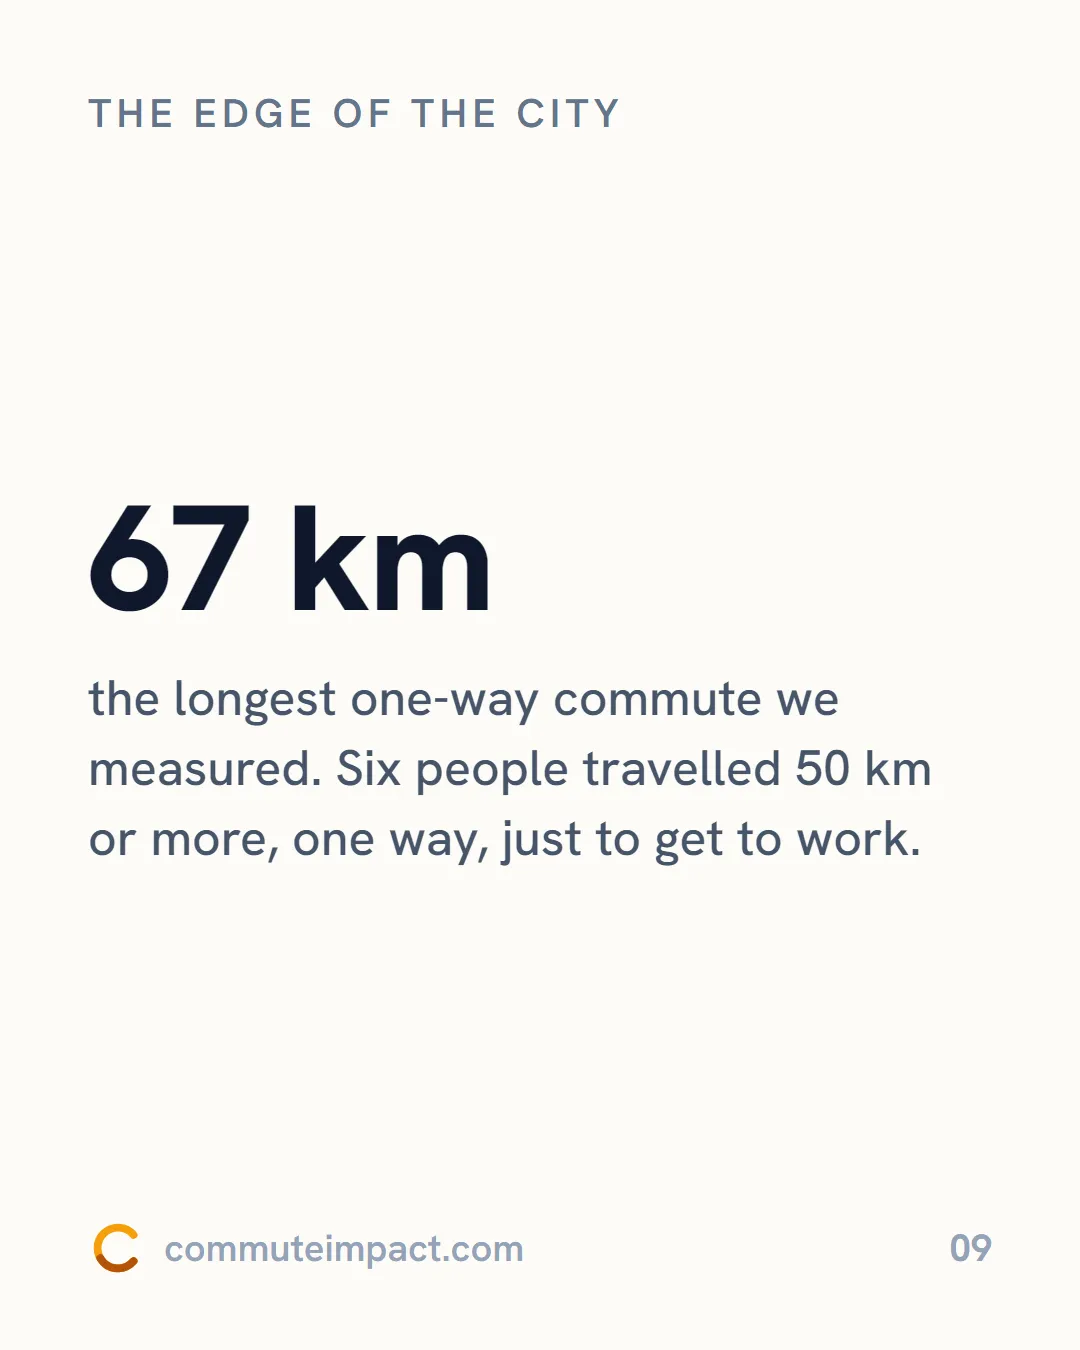
The edge of the city
67 km, the longest one-way commute we measured. Six people travelled 50 km or more, one way, just to get to work.
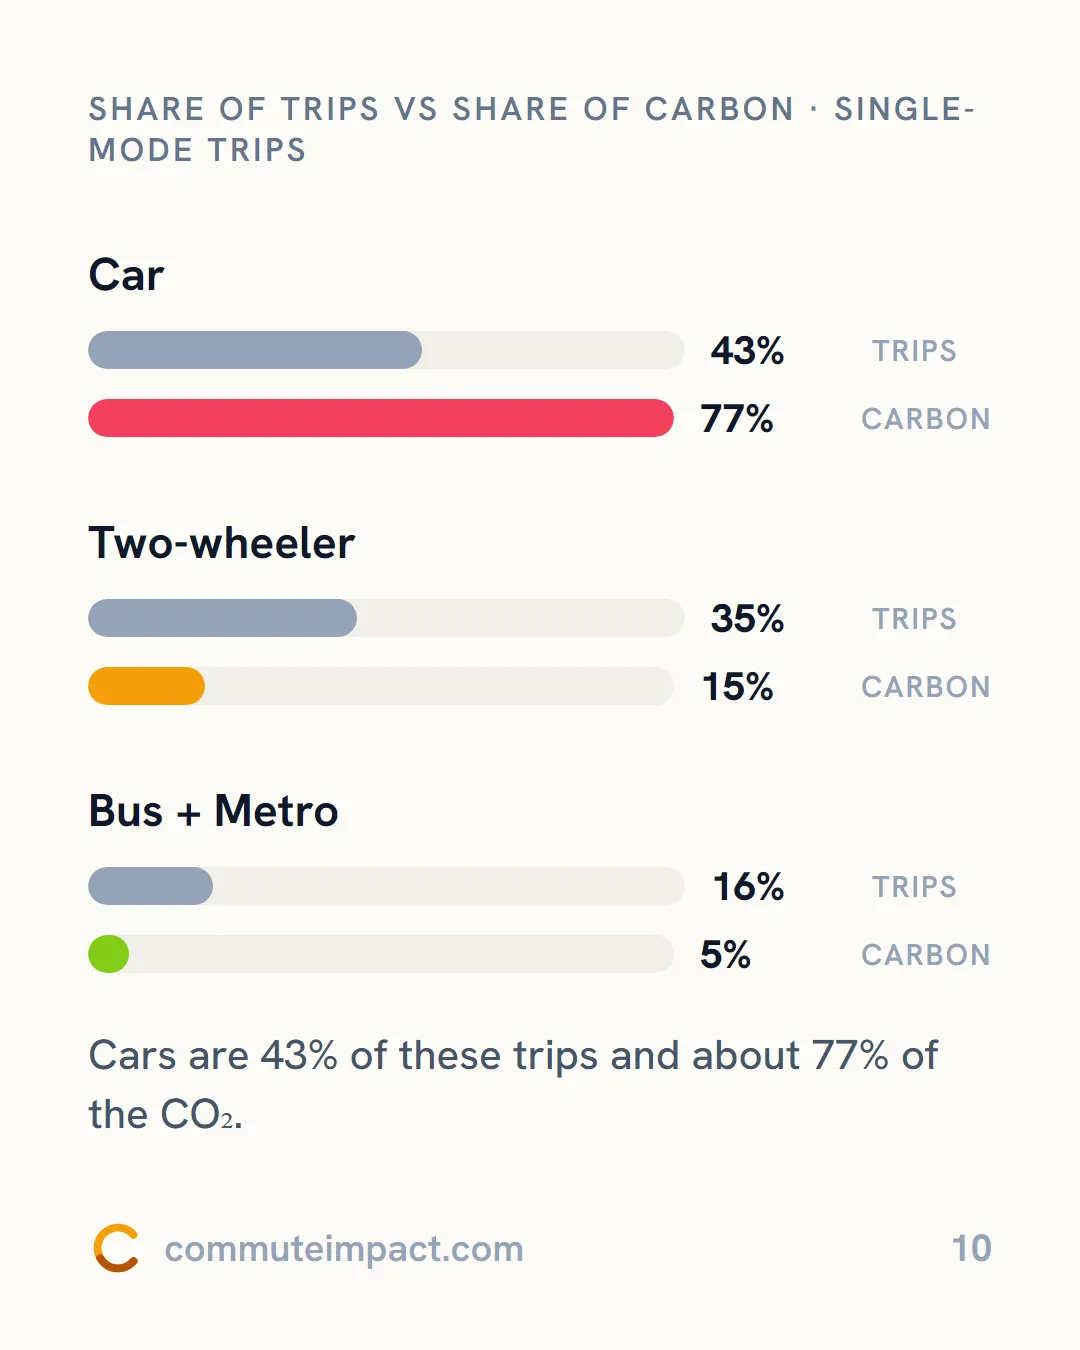
Share of trips vs share of carbon
Single-mode trips
| Mode | Trips | Carbon |
|---|---|---|
| Car | 43% | 77% |
| Two-wheeler | 35% | 15% |
| Bus + Metro | 16% | 5% |
Cars are 43% of these trips and about 77% of the CO₂.
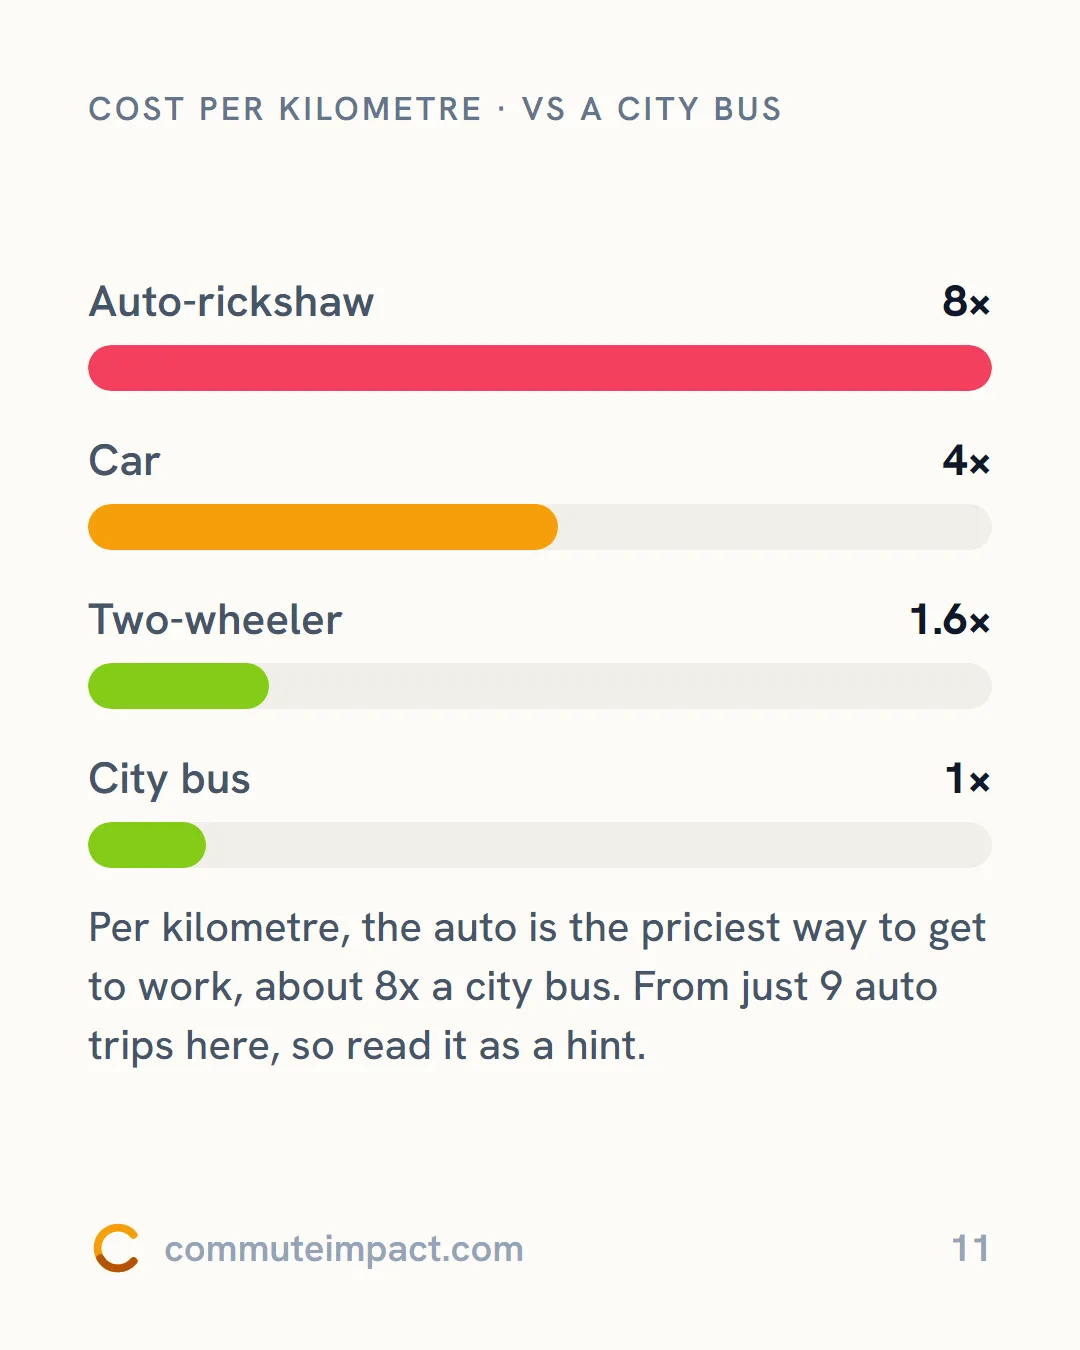
Cost per kilometre
vs a city bus
- Auto-rickshaw 8×
- Car 4×
- Two-wheeler 1.6×
- City bus 1×
Per kilometre, the auto is the priciest way to get to work, about 8× a city bus. From just 9 auto trips here, so read it as a hint.
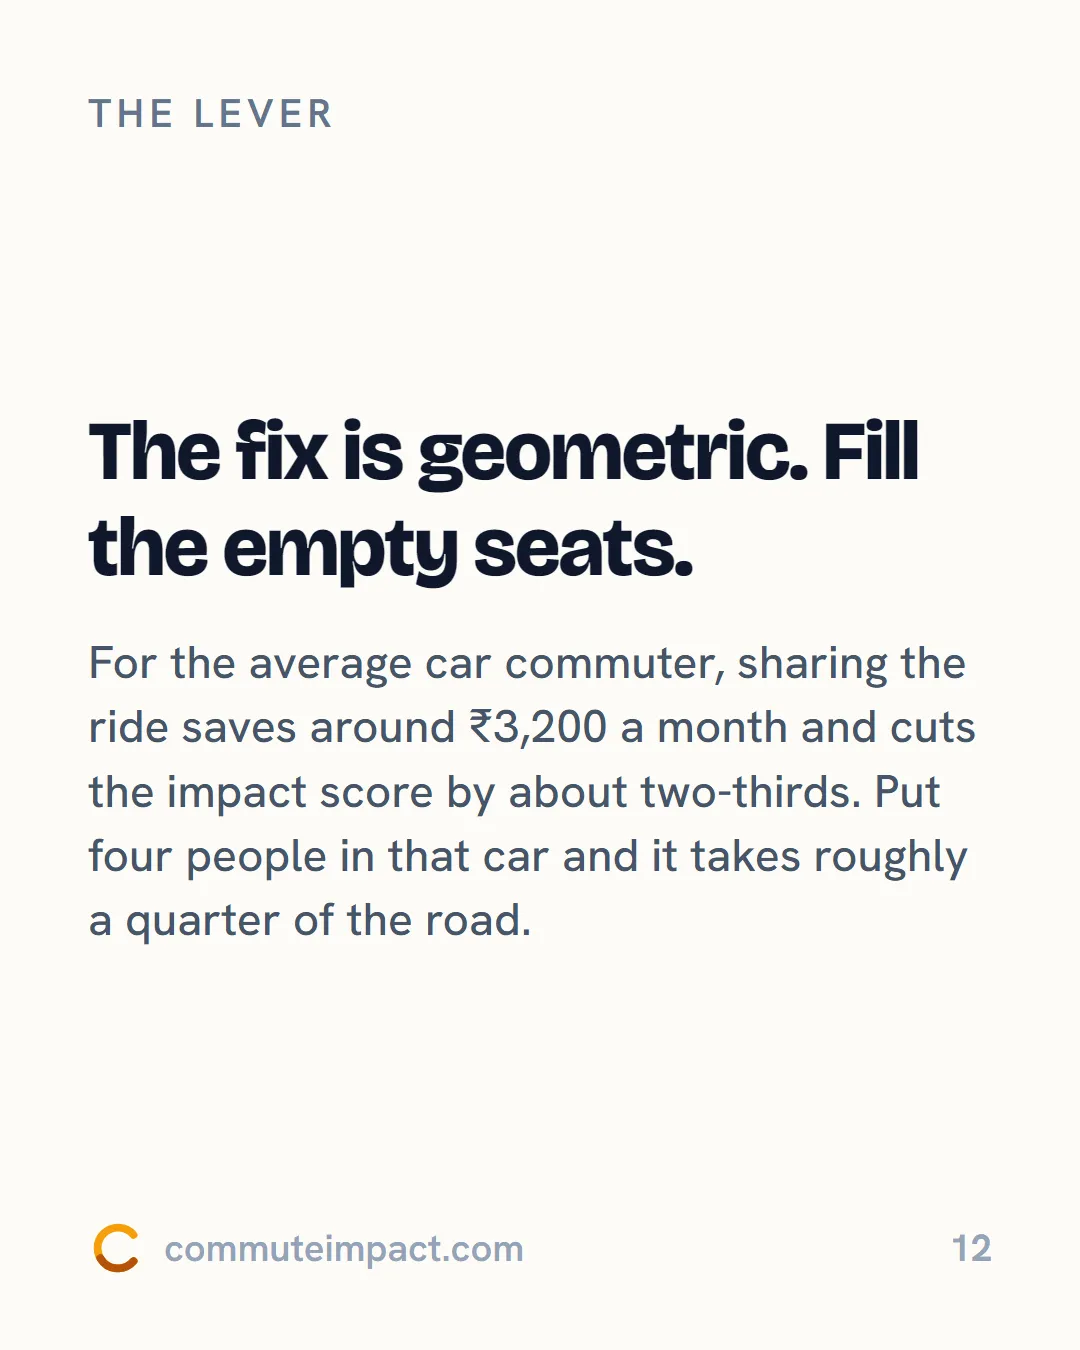
The lever
The fix is geometric. Fill the empty seats.
For the average car commuter, sharing the ride saves around ₹3,200 a month and cuts the impact score by about two-thirds. Put four people in that car and it takes roughly a quarter of the road.
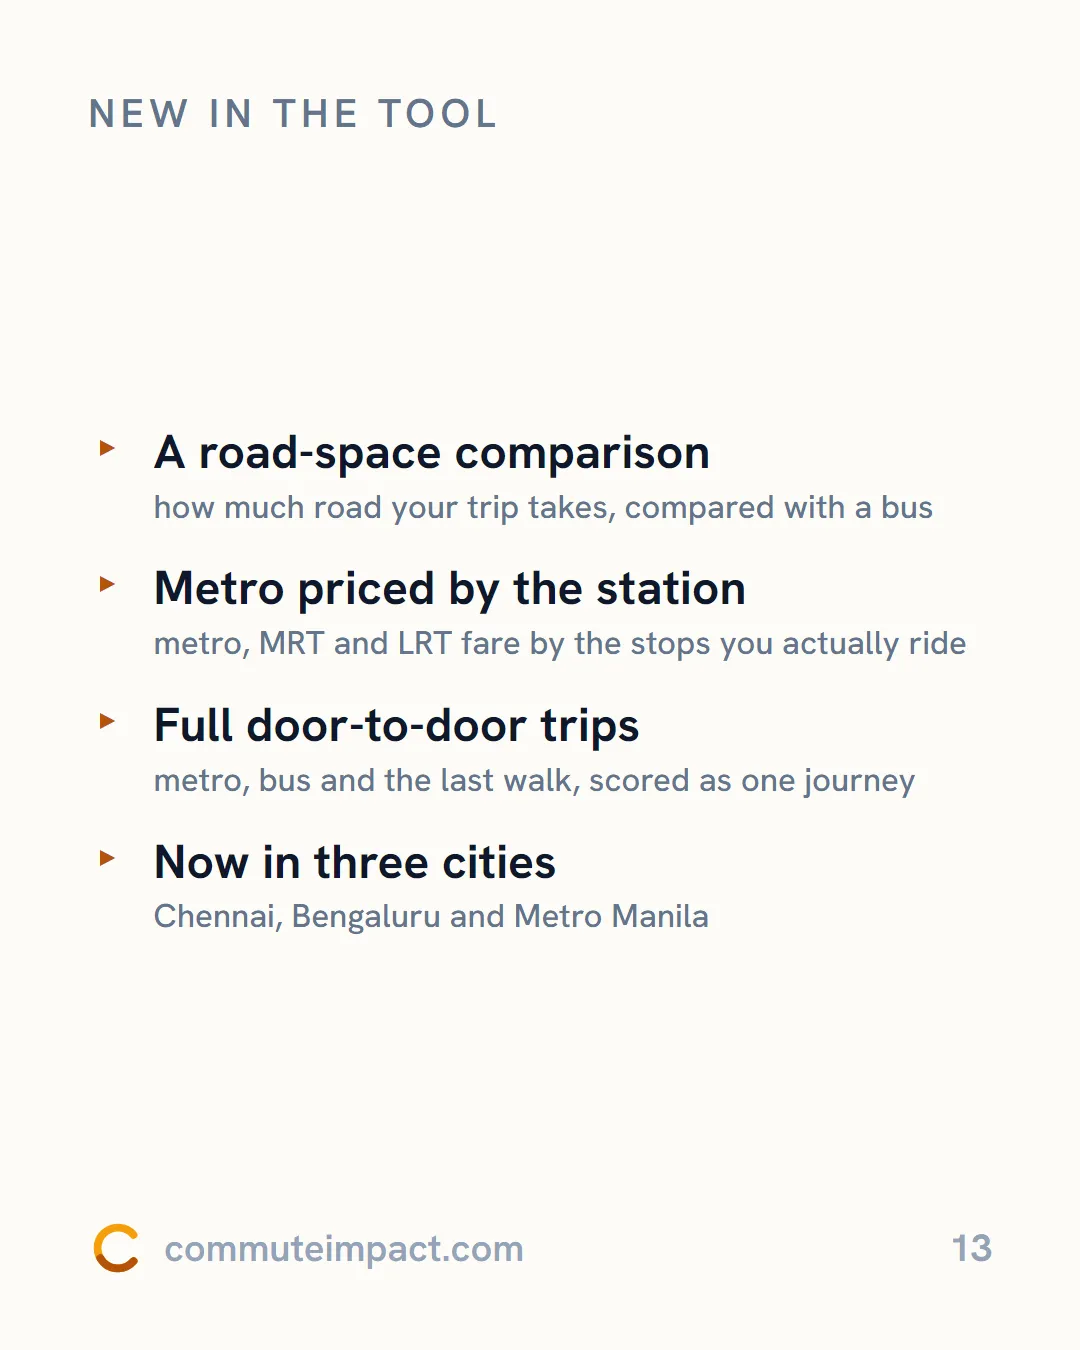
New in the tool
- A road-space comparison: how much road your trip takes, compared with a bus
- Metro priced by the station: metro, MRT and LRT fare by the stops you actually ride
- Full door-to-door trips: metro, bus and the last walk, scored as one journey
- Now in three cities: Chennai, Bengaluru and Metro Manila
Try it
Check any commute
Free, no sign-up. commuteimpact.com